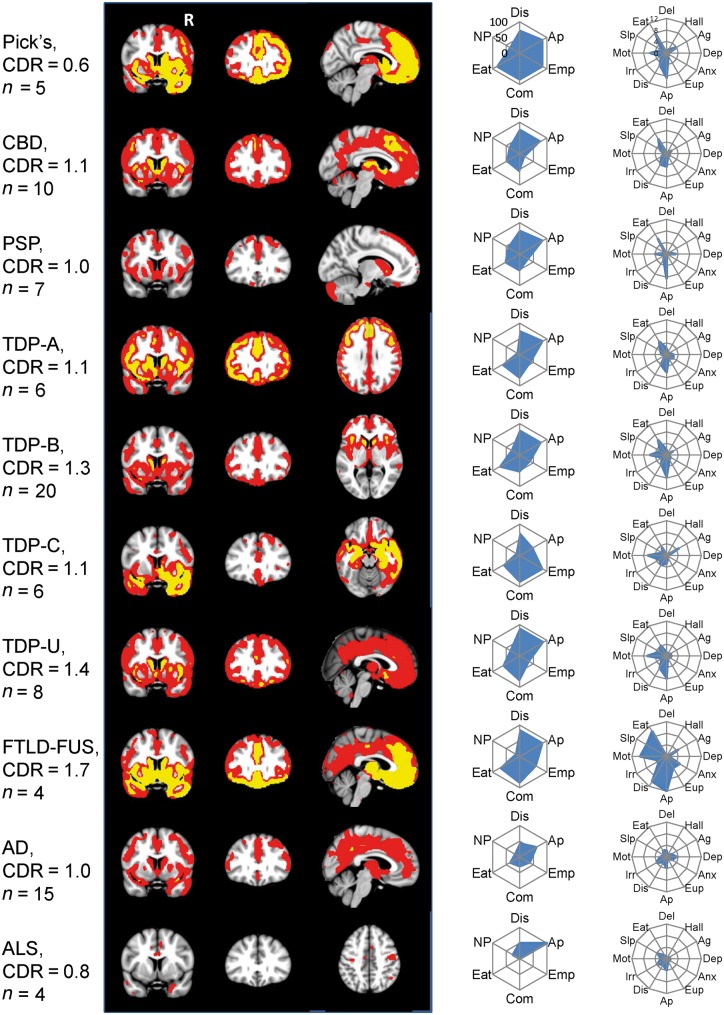
Figure 3.
Grey matter atrophy maps and frequency of behavioural features by pathological diagnosis. Imaging shows maps of grey matter atrophy at a threshold of W > 1.5 (red) and W > 3 (yellow). Radial plots display the frequency (0–100%) of meeting each of the six FTDC diagnostic criteria at first presentation and mean NPI subscale scores (0–12). Right side of coronal and axial images corresponds to the right side of the brain. AD = Alzheimer’s disease; Ag = agitation; Anx = anxiety; Ap = apathy; Com = compulsions; Del = delusions; Dep = depression; Dis = disinhibition; Eat = eating behaviour; Emp = loss of empathy; Eup = euphoria; Hall = hallucinations; Irr = irritability; Mot = aberrant motor behaviour; NP = neuropsychological profile; Slp = sleep.

