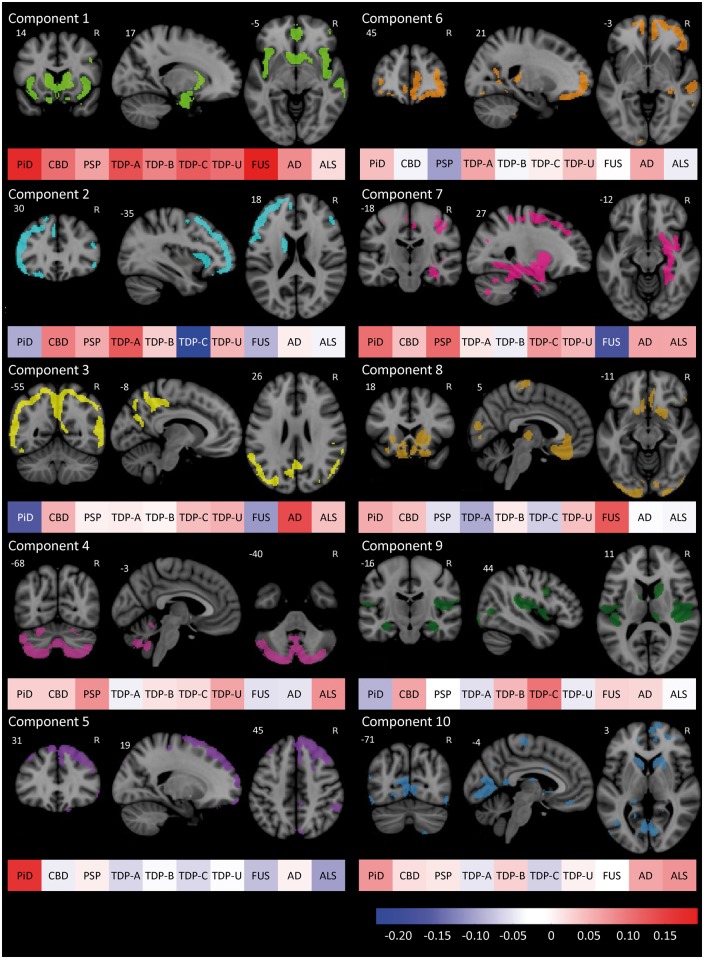
Figure 5.
PCA of grey matter W-score maps. The top 25% of voxels contributing to the first 10 components from the principal component analysis. With each is a colour bar representing the mean score for each component of all included subjects with each of the top 10 diagnoses. n = 82. AD = Alzheimer’s disease; PiD = Pick’s disease.

