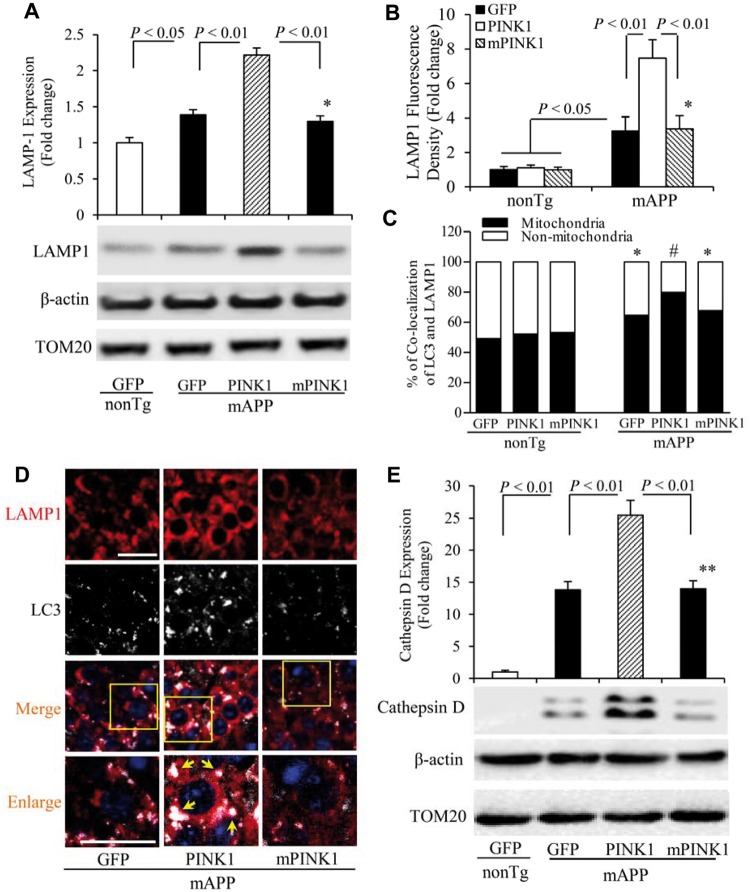
Figure 4.
PINK1 promotes lysosomal recruitment in mAPP mice. (A) Representative immunoblots show immunoreactive bands for LAMP1 protein from hippocampal homogenates from indicated mice, and β-actin served as a loading control. The bar graph (A) presents quantification of immunoreactive bands for LAMP1 protein normalized to β-actin. n = 3 mice per group. (B–D) Quantification of LAMP1-positive immunostaining intensity is shown in B, and quantifications of LAMP1 in mitochondria and non-mitochondria are shown in C. Representative images of LAMP1 in hippocampi of indicated mice are shown in D, and the bottom panels show enlarged images of the field of interest indicated by the box in the top panels. (E) Representative immunoblots show immunoreactive bands for cathepsin D from hippocampal homogenates of indicated mice, and β-actin served as a loading control. The bar graph (E) presents quantification of immunoreactive bands for cathepsin D protein relative to β-actin. n = 3–5 mice and 5–8 slides per group. *P < 0.05, **P < 0.01 versus non Tg group in A–C and E. #P < 0.01 versus mAPP/GFP or mAPP/mPINK1 mice in C. Scale bars = 25 μm in D.

