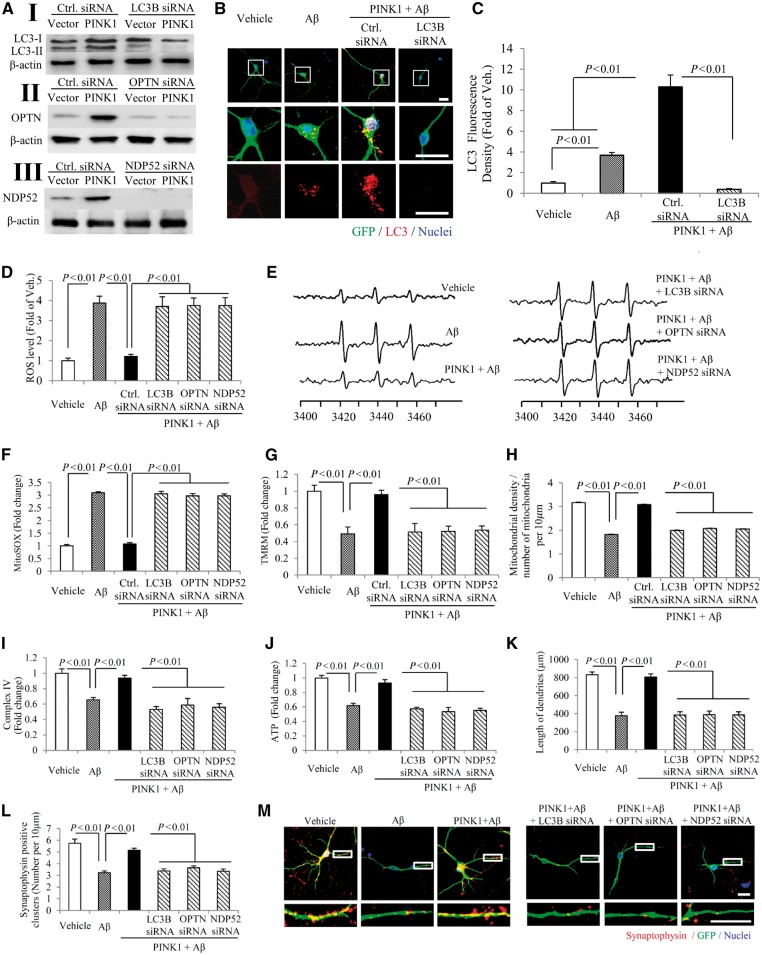
Figure 7.
Effect of autophagy signalling on PINK1/amyloid-β-induced mitochondrial and synaptic alterations. (A) Immunoblotting of cell lysates for LC3 (I), OPTN (II) and NDP52 (III) in the indicated groups of cells. Hippocampal neurons at in vitro Day 10 (DIV 10) were transduced with PINK1 and co-transfected with siRNA against LC3, OPTN, NDP52 and control siRNA. The expression levels of LC3-II, OPTN, and NDP52 were eliminated in neurons treated with corresponding siRNA compared to control siRNA (I–III). n = 3 independent experiments. (B and C) Representative images for PINK1/GFP (green), LC3 (red) and nuclei (blue) in the indicated groups of neurons (B) and quantification of LC3-positive puncta (C). (D and E) Quantification of EPR spectra (D) and representative spectra of EPR (E) in the indicated neurons. (F–J) Quantifications of MitoSOX staining (F), TMRM staining (G), mitochondrial density (H), CcO activity (I), and ATP level (J) in the indicated neurons. (K–M) Quantifications of length of dendrites (K), synaptophysin-positive clusters (l), and representative images (M) for synaptophysin (red), GFP (green), and nuclei (blue). The lower panels show enlarged images of field of interest indicated by the box in the upper panels (M). n = 10 neurons for LC3-positive puncta counting, MitoSOX™ and TMRM staining quantifications, n = 10 for EPR, n = 3 for CcO activity and ATP level, and n = 20 neurons for quantifications of length of dendrites and synaptophysin-positive clusters. Scale bars = 25 μm in B.

