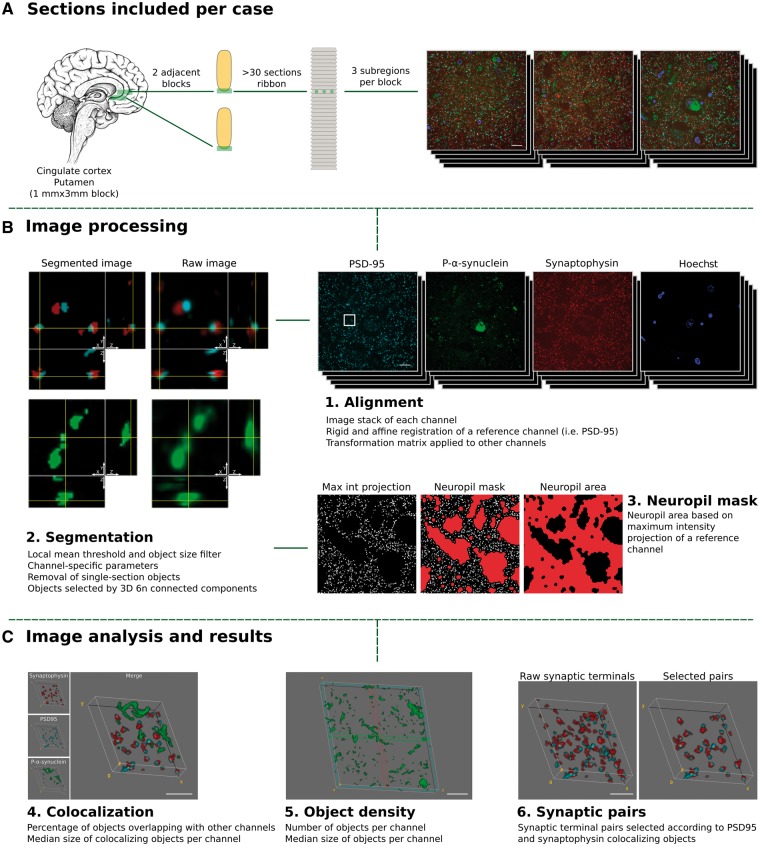
Figure 1.
Study design. Tissue collection and processing of each case is shown in A. For each case, two adjacent tissue sections of cingulate cortex or the striatum (putamen nucleus) were processed and embedded in LR white. For each block a ribbon of >40 consecutive sections of 70 nm was produced. Each ribbon was immunostained for synaptophysin (red), p-α-synuclein (green) and PSD-95 (cyan), synapsin I or α-synuclein, and nuclei were visualized with Hoechst 33258 (blue). Three subregions were imaged through the entire ribbon. (B and C) Processing and analysis of the images. 1. First, individual channel stacks were produced, with all consecutive sections imaged. Consecutive sections of a reference channel (i.e. synaptophysin) were registered using a rigid and an affine transformation. Transformation matrices were applied to other channels. 2. Second, images were segmented using an in-house algorithm based on local mean threshold segmentation, removing single section objects, filtering by size, and detecting 3D objects as six neighbour connected components. Raw images (right) and segmented (left) representative images are shown. Each image corresponds to a single 70 nm section with its corresponding orthogonal views. 3. Neuropil area was calculated based on a maximum intensity projection of synaptophysin channel. 4. Co-localization between the channels of interest and the sizes of co-localizing objects was calculated. 5. The object density and object size were quantified and (6) for entire synaptic studies, segmented images of synaptophysin (presynaptic) and PSD-95 (postsynaptic) channels combined to remove all those objects without pre- and postsynaptic pairs. Max Int = maximum intensity; 6 n = six neighbour. Scale bars in A and B = 10 µm; C = 2 µm.

