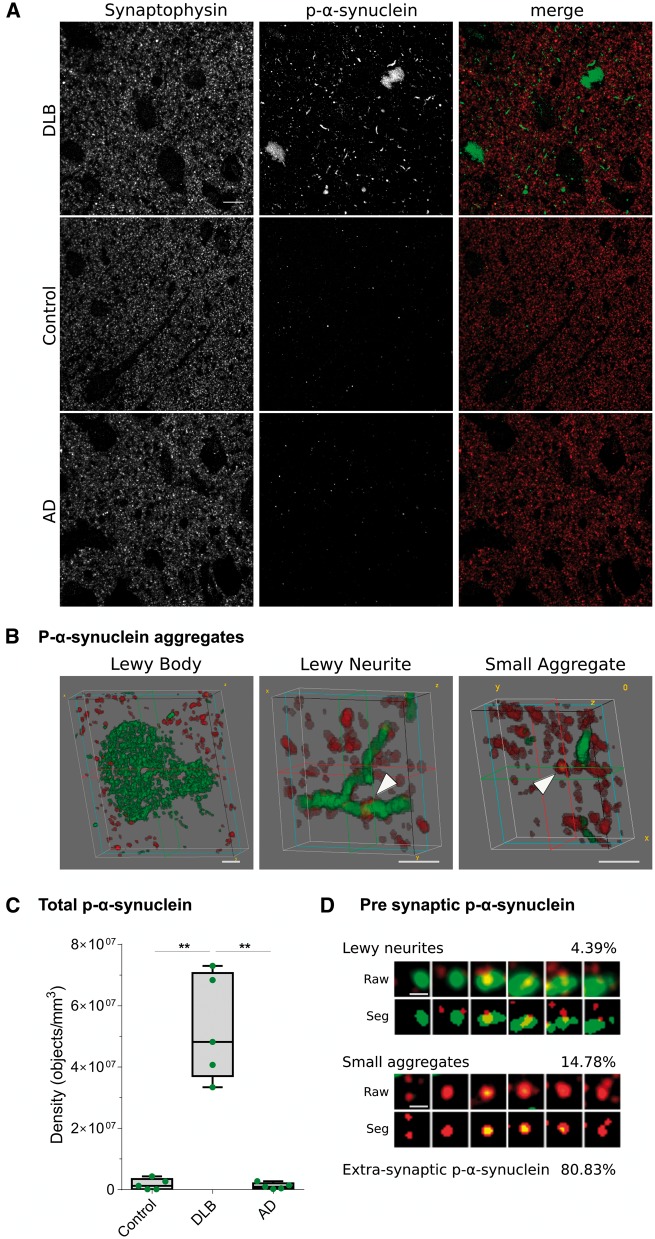
Figure 2.
P-α-synuclein immunoreactivity patterns and synaptic localization. (A) Representative images of DLB, control and Alzheimer’s disease cases stained with antibodies against synaptophysin (red) and p-α-synuclein (green). Each image is a maximum intensity projection of 31 consecutive sections. (B) Representative 3D representations of types of p-α-synuclein aggregates (green) found in DLB cases and synaptophysin terminals (red). Lewy bodies did not co-localize with synaptophysin terminals, while Lewy neurites and small aggregates did (arrowheads). (C) The quantification of total p-α-synuclein objects revealed that pathology was found almost exclusively in DLB cases (**P < 0.01). (D) Synaptograms representing six 70 nm consecutive sections (from left to right) of the Lewy neurite (LN) or small aggregate (SA) indicated by the arrowheads in B. Both the raw and segmented images are shown. The percentages of presynaptic p-α-synuclein found of Lewy neurites or small aggregate and extra-synaptic p-α-synuclein are indicated. AD = Alzheimer disease. Scale bar in A = 10 µm; B = 2 µm; D = 1 µm.

