Figure 6.
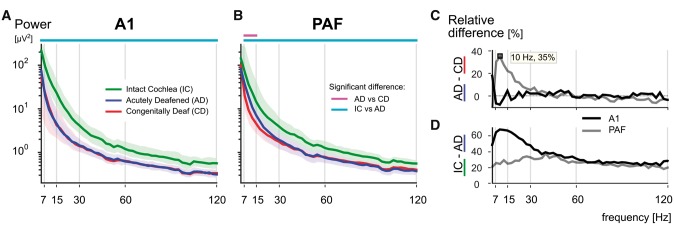
Power spectra of ongoing activity. (A) Grand median power spectra comparison of ongoing activity in hearing animals with intact cochlea (IC, green), hearing acutely deafened animals (AD, blue), and congenitally deaf animals (CD, red) for A1 (shaded areas representing the upper and lower quartiles). Statistical pair comparisons are shown for hearing versus deaf (magenta line above the graph) and animals with intact cochleae versus acutely deafened cochleae (cyan line above the graph) using two-tailed Wilcoxon rank-sum test (FDR corrected q < 0.001). Hearing animals with intact cochlea show significantly more power in the baseline throughout all frequencies than all other groups. (B) Same as (A) for PAF. (C) Relative difference in the power of ongoing activity between hearing acutely deafened and deaf animals, showing stronger alpha power (10 Hz peak) in hearing animals. Black line = A1; grey line = PAF. (D) Same as C between hearing animals with intact cochlea and those after acute deafening. More ongoing power was found in animals with intact cochleae throughout all frequencies, whereas in A1 it was most prominent in alpha and beta range. Black line = A1; grey line = PAF.

