
Figure 2.
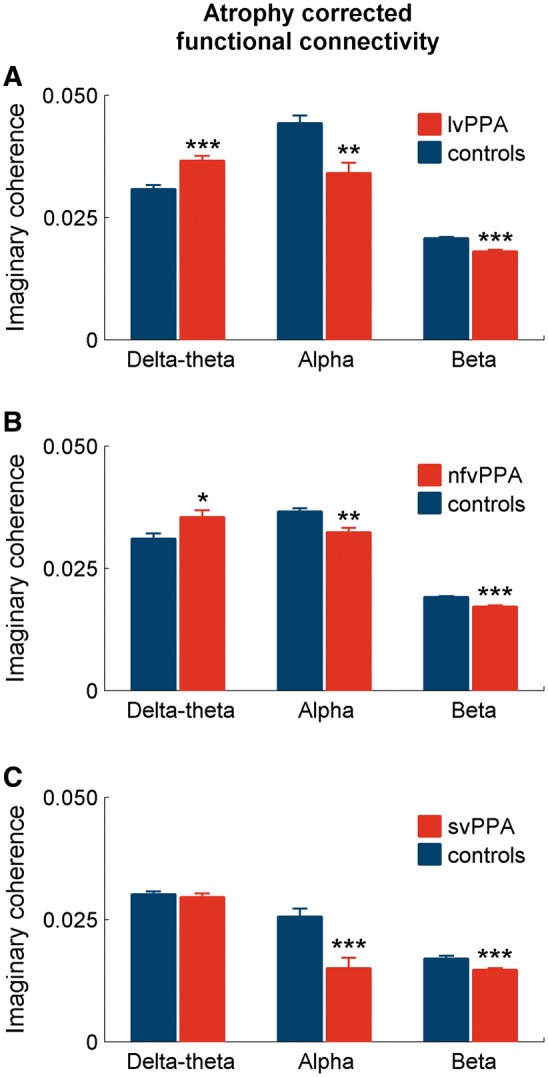
Patterns of functional connectivity differences after correcting for cortical atrophy. The bar plots depict the results from a general linear model analysis for imaginary coherence values including the cortical grey matter volumes as a covariate. The analysis was done for each frequency, comparing each PPA variant and controls. The stars indicate statistically significant differences between patients and controls. (A) lvPPA versus controls; (B) nfvPPA versus controls; (C) svPPA versus controls. *P < 0.05; **P < 0.01; ***P < 0.001.