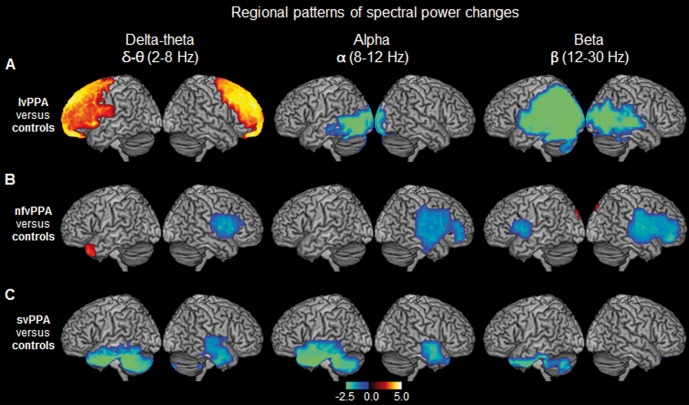
Figure 4.
Spatiotemporal patterns of spectral power distribution in each PPA variant compared to age-matched controls. The rendering brain images depict the distinct patterns of spectral power density for each frequency, in the three PPA variants when compared to age-matched controls. (A) lvPPA versus controls; (B) nfvPPA versus controls; (C) svPPA versus controls. Colours indicate the t-values depicting statistically significant patterns of increased (hot colours) and decreased (cold colours) spectral power within each frequency. From left to right columns represent the frequency bands: delta-theta (2–8 HZ); alpha (8–12 Hz); beta (12–30 Hz), respectively. Images are statistically thresholded using cluster correction (20 voxels cut-off) and P < 0.001 for lvPPA, P < 0.01 for svPPA and P < 0.05 for nfvPPA (n = 14 lvPPA; n = 13 svPPA; n = 12 nfvPPA; n = 20 controls).

