
Figure 3. Baseline and projected 10 year chronic HCV prevalence among PWID in multiple sites in Europe for various treatment intervention scenarios.
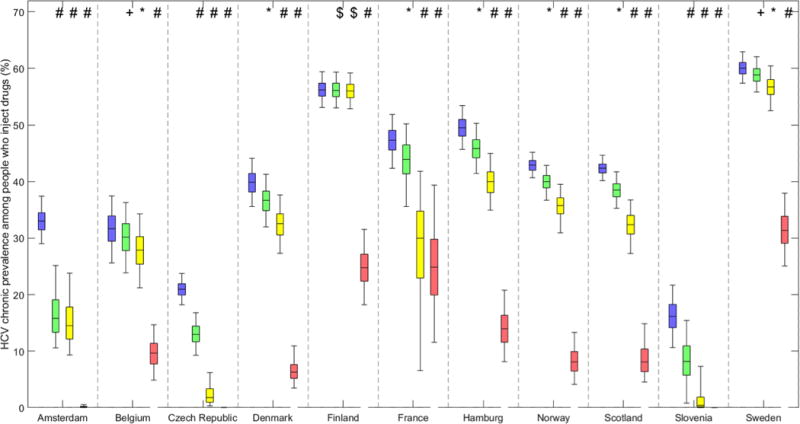
Baseline chronic prevalence (blue boxes) and projected 10 year chronic prevalence if either current treatment rates continue with new DAAs (green boxes), treatment rates are doubled with new DAAs (yellow boxes), or increased to 50 per 1000 PWID annually with new DAAs (pink boxes). Bars indicate the median and interquartile range and whiskers show the 95% credibility intervals.