
Figure 2.
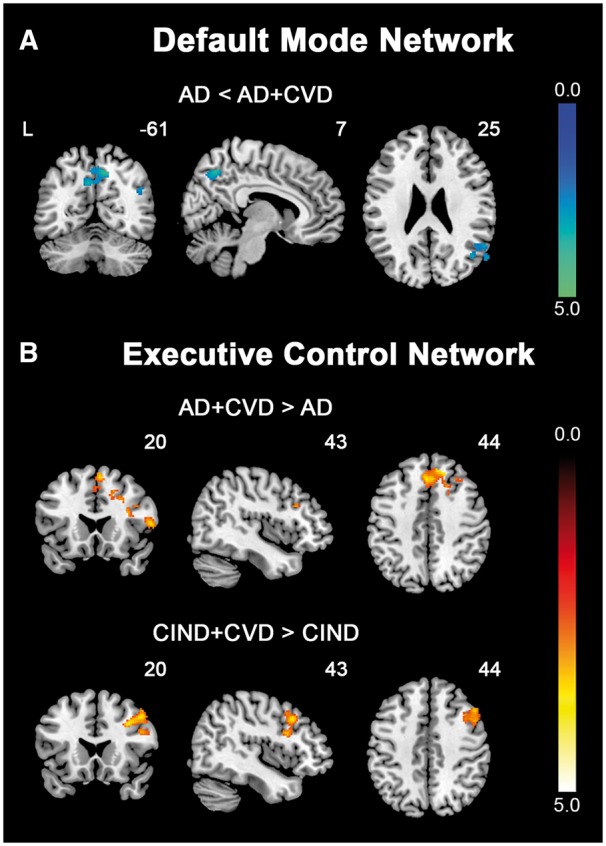
Direct comparisons between patients with and without cerebrovascular disease reveal distinct intrinsic functional connectivity patterns. Group functional connectivity difference maps, overlaid on the MNI template brain, indicate regions showing functional connectivity differences between patients with and without cerebrovascular disease for each intrinsic connectivity network. (A) In the DMN, AD patients showed reduced (cold colour) functional connectivity in key posterior DMN regions, including the precuneus, posterior cingulate cortex and angular gyrus, compared to AD + CVD patients. (B) In the ECN, AD + CVD patients exhibited increased (hot colour) connectivity in the frontal regions compared to AD patients. This increase (hot colour) in frontal connectivity was also observed in CIND + CVD patients compared to CIND patients. Results are displayed at a height threshold of P < 0.01 and a cluster-extent threshold of P < 0.05. Colour bars indicate t-scores.