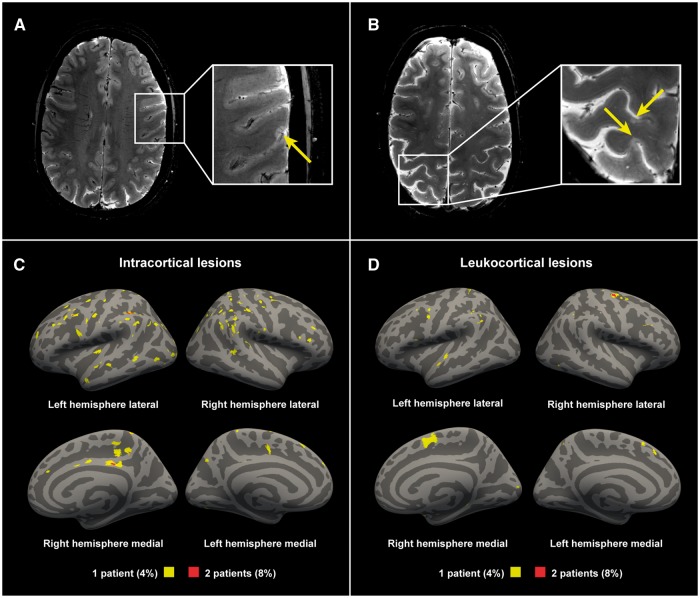
Figure 2.
Examples of cortical lesions detected with 7 T T2*-weighted imaging. (A) A 36-year-old female multiple sclerosis subject with a disease duration of 1.8 years, EDSS score of 0; (B) A 45-year-old female multiple sclerosis subject with a disease duration of 2.9 years, an EDSS score of 3. Lesion probability maps of (C) intracortical lesions and (D) the cortical portion of leukocortical lesions in all multiple sclerosis subjects displayed on fsaverage. Yellow indicating lesions in 4% (1 of 25 subjects). Red indicating 8% (2 of 25 subjects) having overlapping lesions (maximum overlap).

