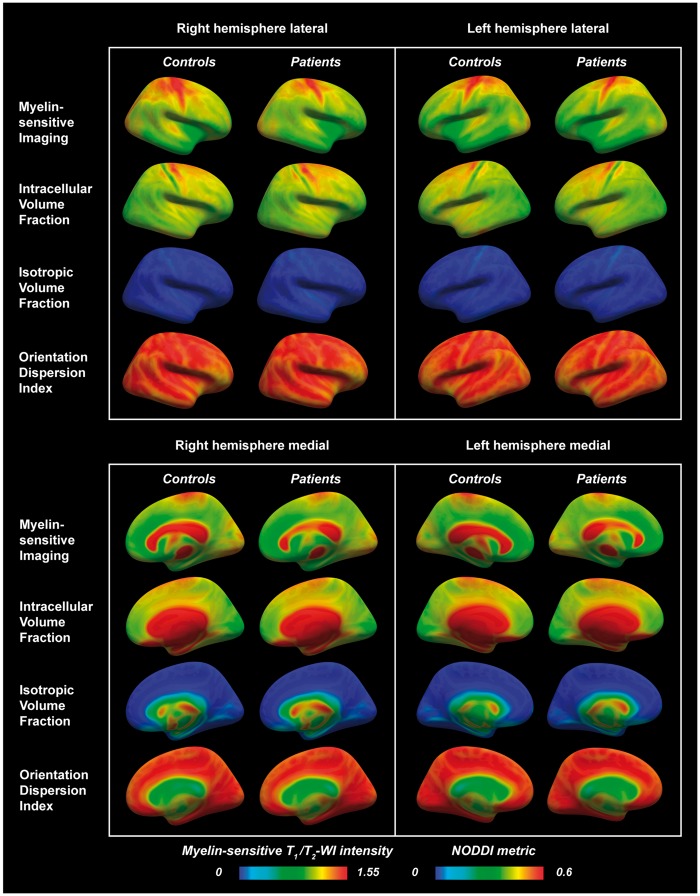
Figure 4.
Lateral and medial views in right and left hemispheres of myelin-sensitive imaging and NODDI metrics sampled at mid-cortical depth in multiple sclerosis subjects and healthy controls and displayed on fsaverage. A trend of lower myelin-sensitive contrast in the superior frontoparietal regions was visually noted in multiple sclerosis subjects compared with controls (blue arrows). A notable topographical organization of the NODDI metrics was seen across the cortex, specifically with clear banding of the metrics in the sensorimotor cortices (purple arrows). WI = weighted imaging.

