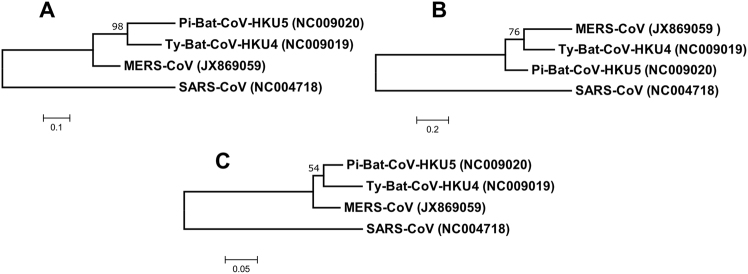
Fig. 2.
Phylogenetic analysis of (a) nucleocapsid, (b) spike and (c) RdRp protein of Ty-BatCoV-HKU4, Pi-BatCoV-HKU5, and MERS-CoV. The trees were constructed by maximum-likelihood method in MEGA 6 using substitution model WAG+G (nucleocapsid), WAG+F+I+G (spike) and LG+G (RdRp) with SARS-CoV as the outgroup. The percentage of trees in which the associated taxa clustered together next to the branches with bootstrap values was calculated from 1000 trees. The scale bars indicate the number of substitutions per 10, 5, and 20 amino acids, respectively

