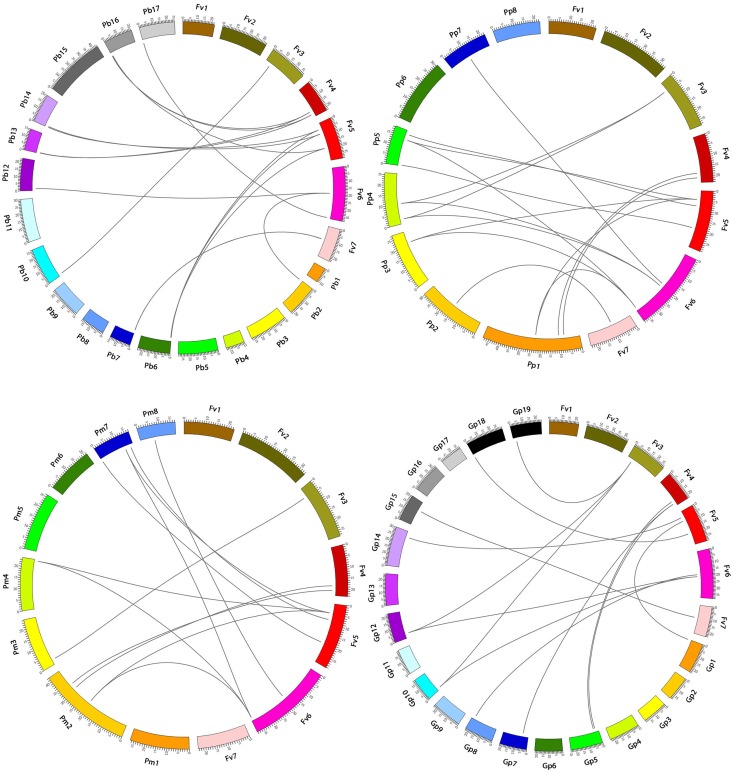
FIGURE 7.
Microsynteny of regions among Strawberry, Pear, Mei, Peach, and Grape. The chromosomes number indicated by different colored boxes and labeled by Fv, Pb, Pm, Pp, and Gp. The different color box also represents the sequence lengths of chromosomes in megabases. The black line indicates the syntenic relationship among the SBP-box regions.

