Figure 3.
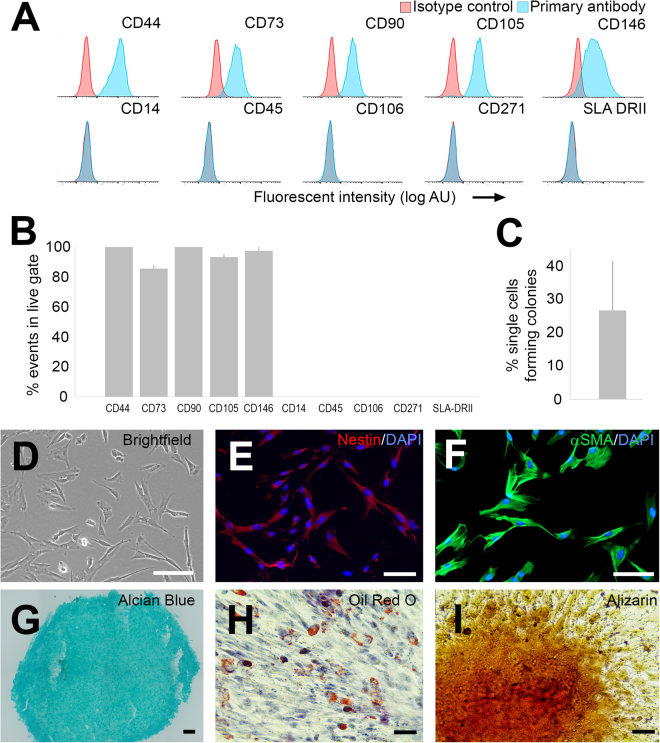
Characterization of MSCs isolated from pig adipose tissue. (A) Representative flow cytometry of MSCs isolated and propagated from adipose tissue for up to 5 passages. Counts with specific immunoreactivity are shown in pale blue. Counts stained with isotype control antibodies are shown in red. (B) Live cells were >70% immunoreactive for CD44, CD73, CD90, CD105, and CD146 and <5% immunoreactive for CD14, CD45, CD106, CD271, and SLA-II DR (N = 3 different pigs). (C) In each culture, many cells could form colonies from single cells (N = 8). (D) Representative brightfield image of cells attached to a tissue culture flask. (E,F) Immunocytochemistry showed that the majority of MSCs expressed the immature cell marker, nestin (red, E) and the actin isoform, alpha smooth muscle actin (alpha SMA, green, F). (G–I) Upon directed differentiation, subpopulations of cells contained mucins (G), lipid droplets (H) or produced calcium (I). Scale bar; D,F = 50 μm, E, H, I = 40 μm, G = 100 μm.

