
Fig. 7. Tat decreases pDrp1 S637 puncta but not pDrp1 S616 puncta in a time-dependent manner.
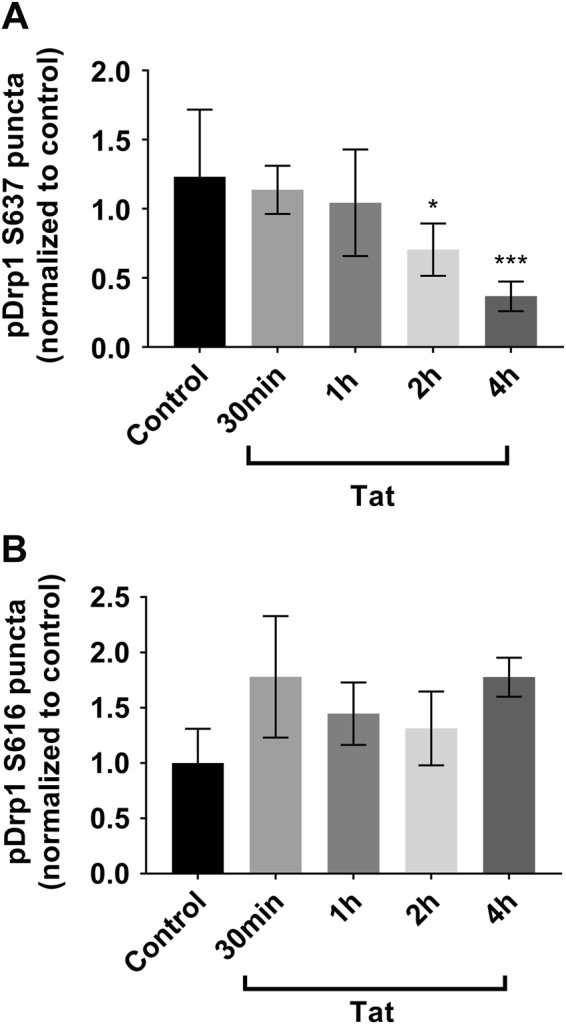
Cortical neurons were exposed to Tat for the indicated times, fixed, and then stained for pDrp1 S637 (a) or pDrp1 S616 (b). Quantification of pDrp1 S616 and pDrp1 S616 puncta was done as described in Materials and Methods. Data, expressed as mean ± SEM, are normalized to control and represent an average of three independent experiments (n = 10 neurons each experiment). *p < 0.05, ***p < 0.001 vs control (ANOVA and Tukey’s test)