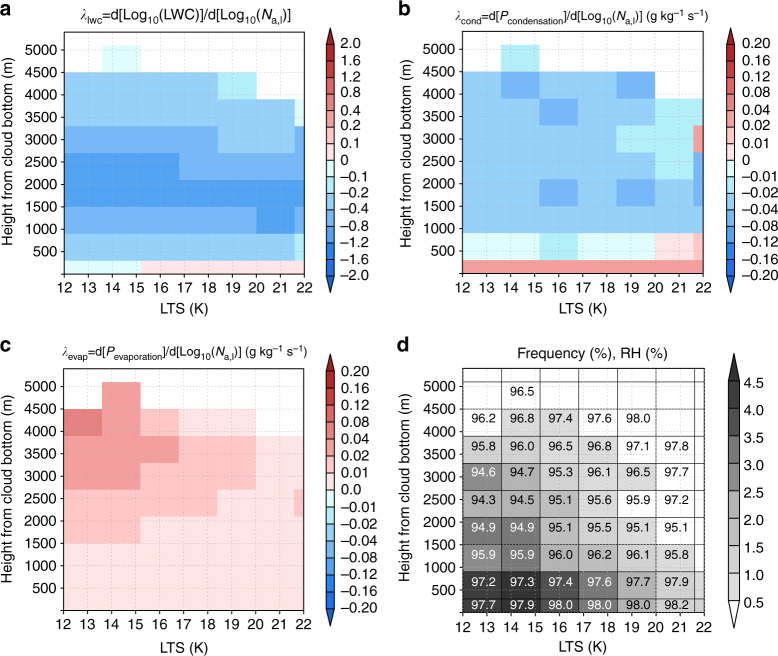
Fig. 2.
The vertical distribution of variables to explain the reasons for the negative value of λ simulated by the global cloud system resolving model. Distribution of the a λlwc, b response of the condensation tendency (Pcondensation) to aerosol perturbations (λcond), c response of the evaporation tendency (Pevaporation) to aerosol perturbations (λevap), and d frequency and relative humidity (RH) over the lower tropospheric stability (LTS)-height from the cloud bottom plane simulated by the GCRM. The number in each grid of d indicates the RH (%). Results over the ocean between 60o S to 60o N were used for creating these figures. The cloud bottom was determined as the lowest layer of the grid where the average liquid water content (LWC) was larger than 10−5 kg kg−1

