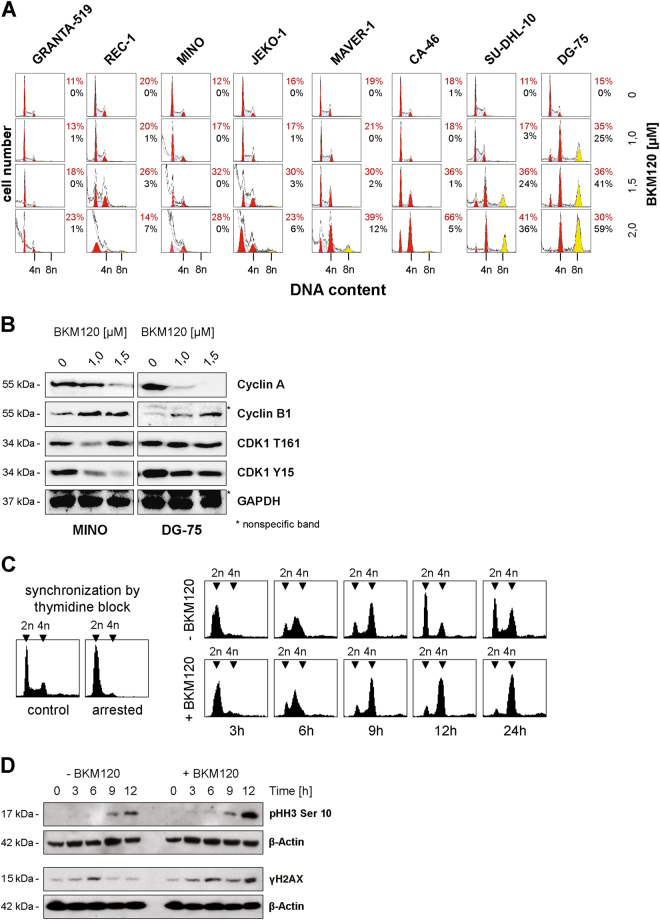
Fig. 3. BKM120 induces mitotic arrest.
a Cell cycle distribution of NHL cell lines incubated with the indicated concentrations of BKM120 for 72 h. Quantification with ModFit LT. Tetraploid cells are designated as 4n and hyperdiploid cells as 8n. Normal DNA content of 2n or 4n is colored in red, cells with hyperdiploid DNA content are yellow. Cells in S-phase are labeled with blue grid. Sub G1 cells are gray. Data are representative for three independent experiments. b Phosphorylation and expression status of cell cycle proteins in the two cell lines MINO and DG-75 after incubation with the indicated concentrations of BKM120 for 24 h. c DG-75 cells were synchronized by a double-thymidine block. Upon release from the thymidine block, DNA content of synchronized control cells and cells treated with 1.5 µM BKM120 was analyzed by flow cytometry. Representative histograms are shown. d Expression of the mitotic marker phospho-histone H3 (pHH3) Ser10 in synchronized DG-75 control and BKM120 treated cells was analyzed by Western blot analysis

