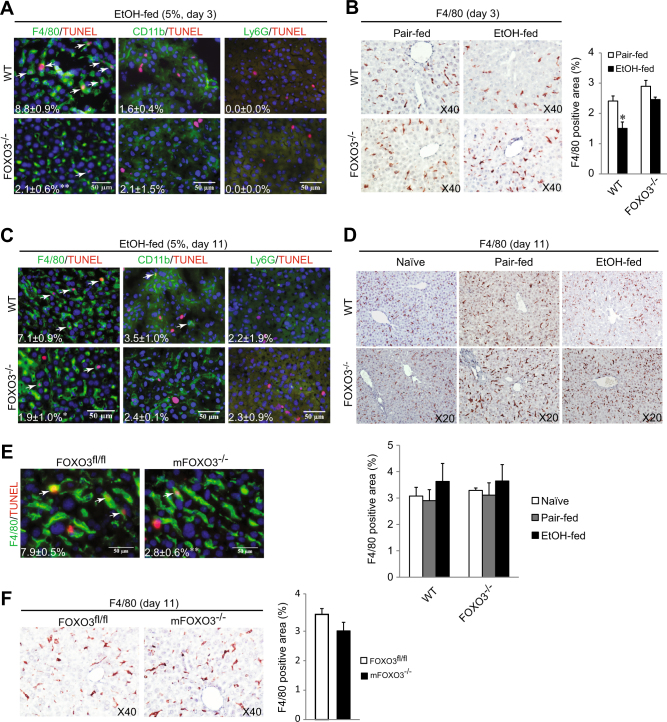
Fig. 2. Myeloid FOXO3 is response for alcohol-induced macrophage apoptosis.
a–d WT and Foxo3−/− mice were fed either control (Pair-fed) or alcohol (EtOH-fed) diet. a Co-staining of TUNEL and myeloid cell markers after 2 days of ethanol. Arrow indicates double positive cells. Numbers indicate percent TUNEL positivity in each cell type. n = 3. b IHC staining for F4/80 in liver sections after 2 days of ethanol. Quantification for F4/80 is shown as percentage of total section area. n = 3–5. c TUNEL myeloid cell marker co-staining 10 days of ethanol. Arrows indicate double positive cells. Numbers indicate percent TUNEL positivity in each cell type. n = 3–4. d IHC staining for F4/80 in liver sections after 10 days of ethanol. Quantification for F4/80 is shown as percentage of total section area. n = 3–5. e–f LysM cre-Foxo3fl/fl (LysM Foxo3) and matched littermate control mice (Foxo3fl/fl) were pair-fed or fed with ethanol diet for 10 days. e Co-staining of TUNEL and F4/80 in liver sections. Arrows indicate double positive cells. Numbers indicate percent of F4/80 positive cells that were TUNEL positive. n = 3. f IHC staining for F4/80 in liver section from mice were fed with ethanol for 10 days. Quantification for F4/80 is showing as percentage of total section area. n = 3. All data were statistically analyzed with two-tailed Student’s t test, and presented as mean ± SEM. *P < 0.05

