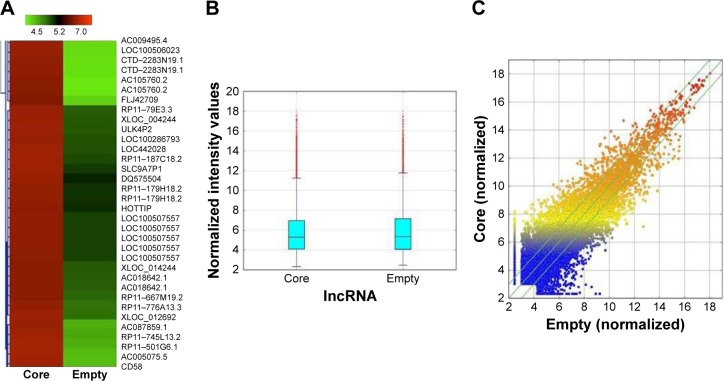
Figure 1.
The hot map of lncRNA array analysis. (A) Hot map was generated for lncRNA expression in Huh7-core cells compared with Huh7-vector cells. (B) Box plot is a convenient way to quickly visualize the distribution of a dataset. It is commonly used for comparing the distributions of the intensities from all samples. (C) Scatter plot is a visualization method used for assessing the lncRNA expression variation between the two compared samples. The values of X and Y axes are the normalized signal values of the samples (log2 scaled). The green lines are fold change lines. The lncRNAs above the top green line and below the bottom green line indicated more than 2-fold change of lncRNAs between the two compared samples.
Abbreviation: lncRNA, long noncoding RNA.

