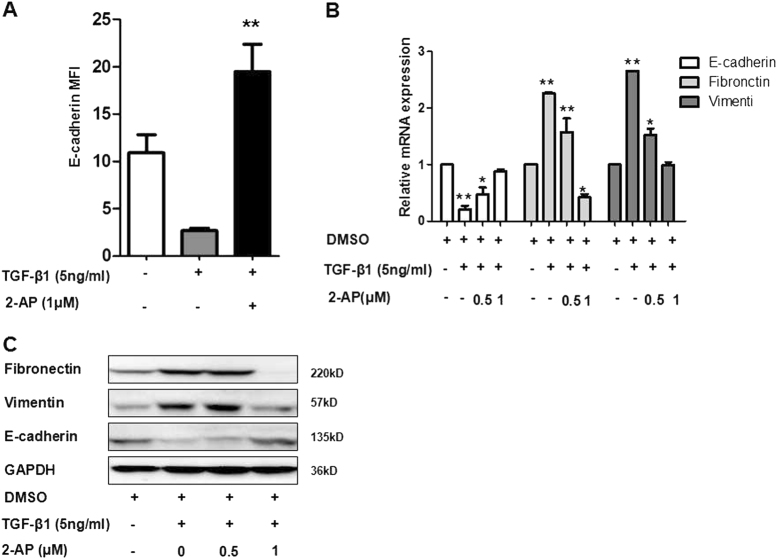
Fig. 2. Effect of 2-AP on expression of the epithelial marker E-cadherin and the mesenchymal markers fibronectin and vimentin.
a A549 cells were treated with 2-AP and TGF-β1 as Fig. 1c, and the mean fluorescence intensity of E-cadherin was determined. b A549 cells were treated with DMSO (control), 5 ng/mL of TGF-β1, 5 ng/mL of TGF-β1 + 0.5 µM of 2-AP, or 5 ng/mL of TGF-β1 + 1 µM of 2-AP for 24 h. Results of mRNA expression analysis showed between-group differences for E-cadherin, fibronectin, and vimentin. Experiments were repeated at least in triplicate (n = 3). *P < 0.05; **P < 0.01. c Western blot was applied to assess changes in protein levels of E-cadherin, fibronectin, and vimentin. GAPDH was used as an internal loading control. Data shown are representative of three independent experiments

