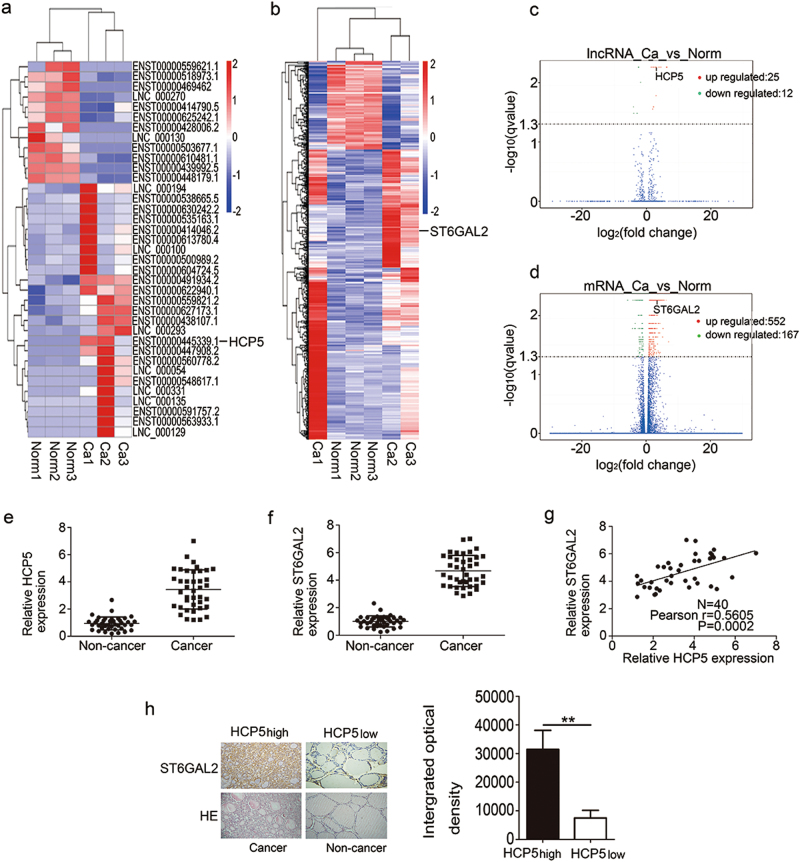
Fig. 1. HCP5 or ST6GAL2 expression is up-regulated in FTC.
a, b, c, d The heat maps and volcano plot showed that HCP5 or ST6GAL2 expression was up-regulated in FTC tissues. e, f According to the qPCR results, HCP5 and ST6GAL2 were overexpressed and g we found a positive relationship between ST6GAL2 and HCP5 expression in FTC tissues. h Immunostaining demonstrated that ST6GAL2 expression was high in the tissues with HCP5 overexpression (**pvalue < 0.01), scale bars: 20 μm

