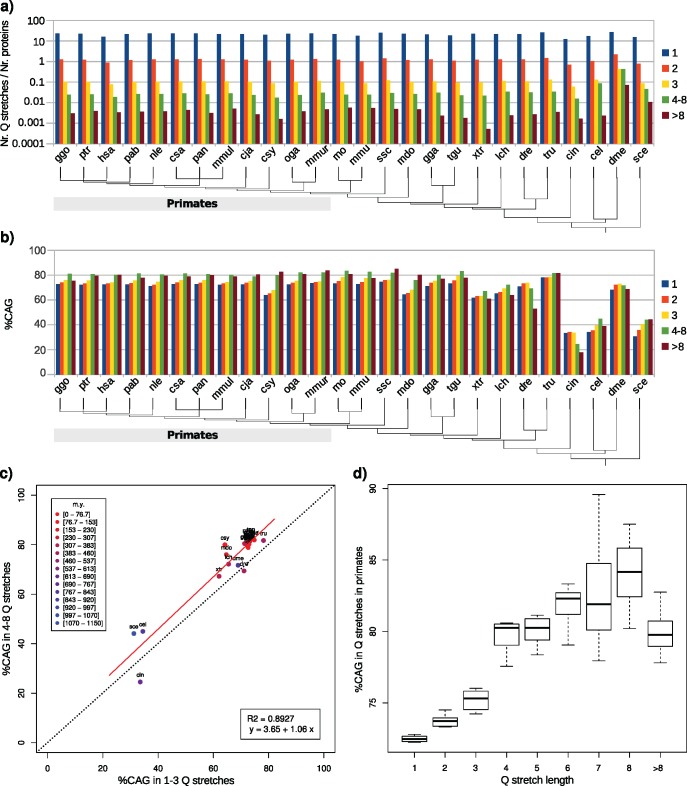
Fig. 1.
—Characterization of glutamine stretches in complete proteomes. (a) Number of glutamine stretches per number of proteins per proteome, depending on the stretch length. (b) Percentage of CAG triplets in glutamine stretches per proteome, depending on the stretch length. (c) Percentage of CAG triplets in glutamine stretches of lengths 4–8 compared with lengths 1–3; the result for each proteome is colored depending on the pairwise divergence time with human. The discontinuous line represents x = y values. (d) Overall CAG percentages in primates in glutamine stretches of varying lengths.

