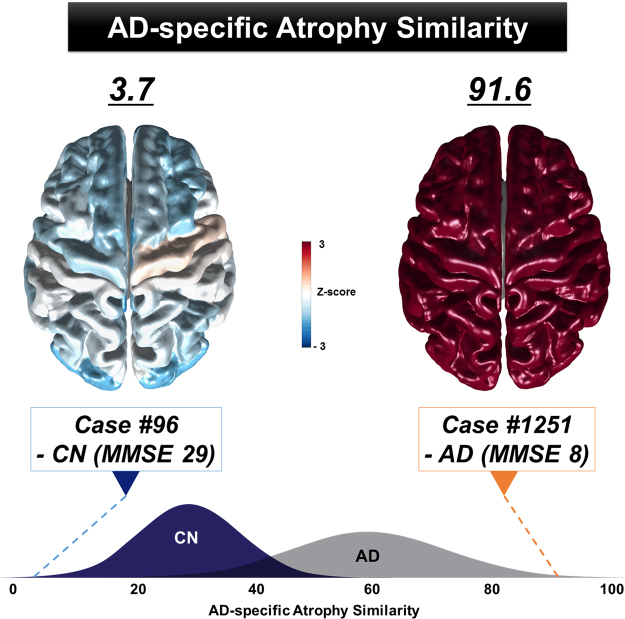
Figure 4.
Examples of AD-specific atrophy similarity measure at the individual-level. The AD-specific atrophy similarity scores differed between Case #96 - CN (left, 3.7) and Case #1256 - AD (right, 91.6). The standardized value (Z-score) maps were computed to visualize the AD-specific atrophy similarity. Positive Z-scores (red) indicate that the regions of brain are similar to the AD-specific patterns of atrophy. AD = Alzheimer’s disease; CN = cognitively normal; MMSE = mini-mental state examination.

