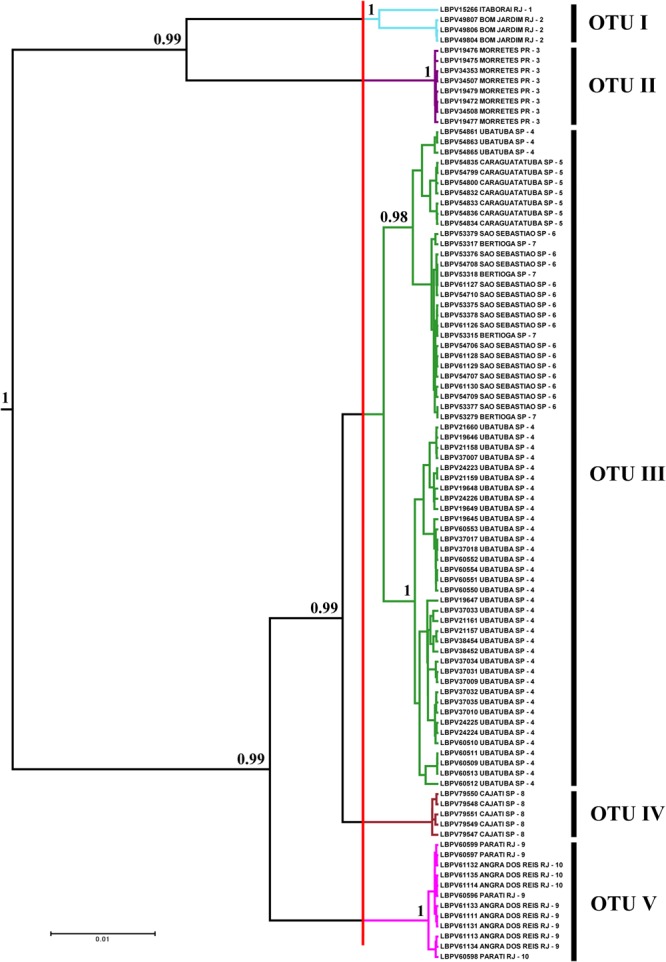
FIGURE 2.

Bayesian tree showing the distribution of specimens by OTUs selected through GMYC analysis. Numbers after branches are posterior probabilities. Values below 0.95 are not shown. The vertical red line represents the threshold time (–0.0055687) – the limit between species and population according to the GMYC model in the tree. The colors of the branches to the right of the red line correspond to the colors of the paleodrainages in Figure 1, and numbers after are local to collection sites also in Figure 1. LBPV is the code for samples of the fish collection of the Laboratório de Biologia e Genética de Peixes on the Bold systems site.
