
Figure 2.
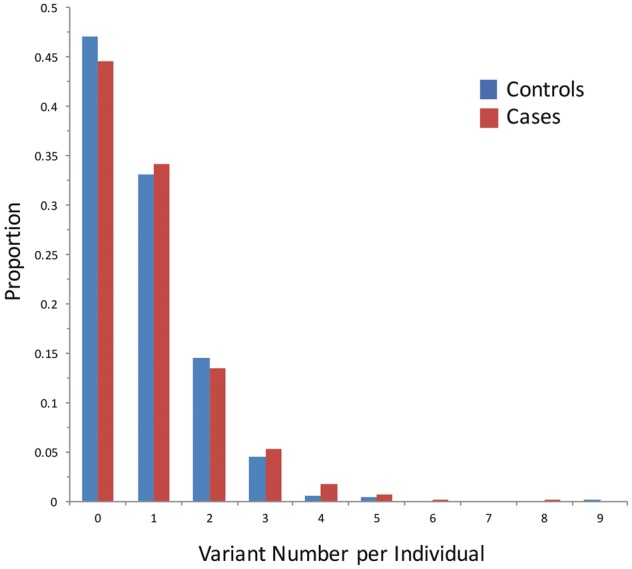
Distribution of LSD variants in the IPDGC cohort. The number of likely damaging LSD variants (MAF < 3%, CADD C-score ≥ 12.37) per individual is shown versus the proportional representation in the IPDGC discovery cohort. Cases (red) and controls (blue) are plotted separately. Many individuals harbour multiple LSD alleles, and the distribution is right-skewed among Parkinson’s disease cases. The analysis considers variants in all 54 LSD genes. Supplementary Fig. 2 shows a similar plot restricted to the five top driver genes.