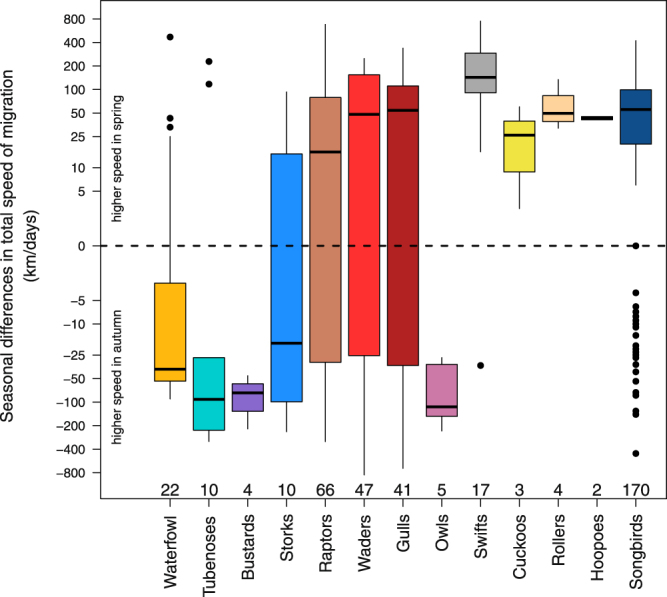
Figure 2.

Individual seasonal differences in total speed of migration for different bird groups. Seasonal differences in total speed of migration as the individual spring value minus its corresponding autumn value for each bird group. Positive values indicated a higher total speed of migration in spring than in autumn and negative values the opposite. The box plots show the median and 25th and 75th percentiles; the whiskers indicate the values within 1.5 times the interquartile range; outliers are indicated by black dots. Different colours indicate different bird groups (waterfowl = orange, shearwater = cyan, bustards = purple, storks = light blue, raptors = light brown, waders = light red, gulls = dark red, owls = light purple, swifts = grey, cuckoos = yellow, rollers = light beige, hoopoes = light grey, and songbirds = dark blue). Sample sizes, i.e., number of individuals, are given above the corresponding bird groups. Y-axis is on a logarithmic scale.
