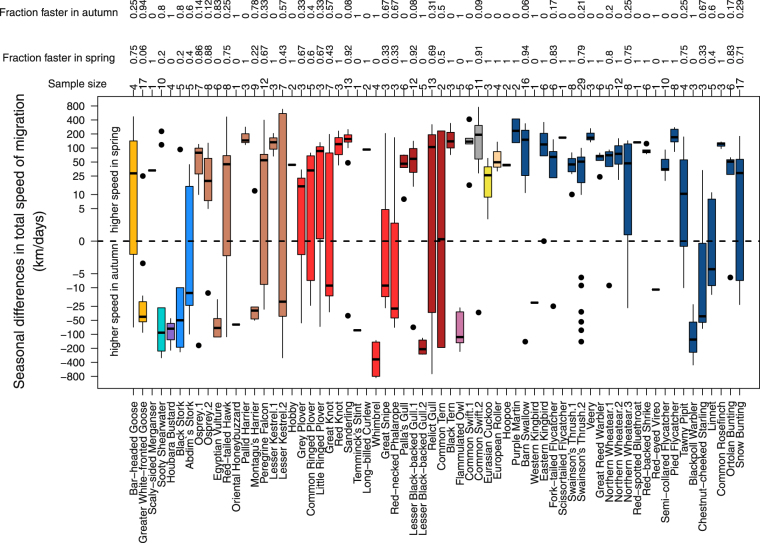
Figure 3.
Individual seasonal differences in total speed of migration per species/population. Seasonal differences in total speed of migration as the individual spring value minus its corresponding autumn value for each species/population. Positive values indicated a higher total speed of migration in spring than in autumn and negative values the opposite. The box plots show the median and 25th and 75th percentiles; the whiskers indicate the values within 1.5 times the interquartile range; outliers are indicated by black dots. Numbers of individual tracks per species/population are given next to the plot and the fractions of individual tracks with faster spring/autumn migration compared to autumn/spring migration are given above the corresponding sample size. Different colours indicate different bird groups (waterfowl = orange, shearwater = cyan, bustards = purple, storks = light blue, raptors = light brown, waders = light red, gulls = dark red, owls = light purple, swifts = grey, cuckoos = yellow, rollers = light beige, hoopoes = light grey, and songbirds = dark blue). Different populations/studies of the same species were distinguished by different numbers, cf. Table S1. Y-axis is on a logarithmic scale.

