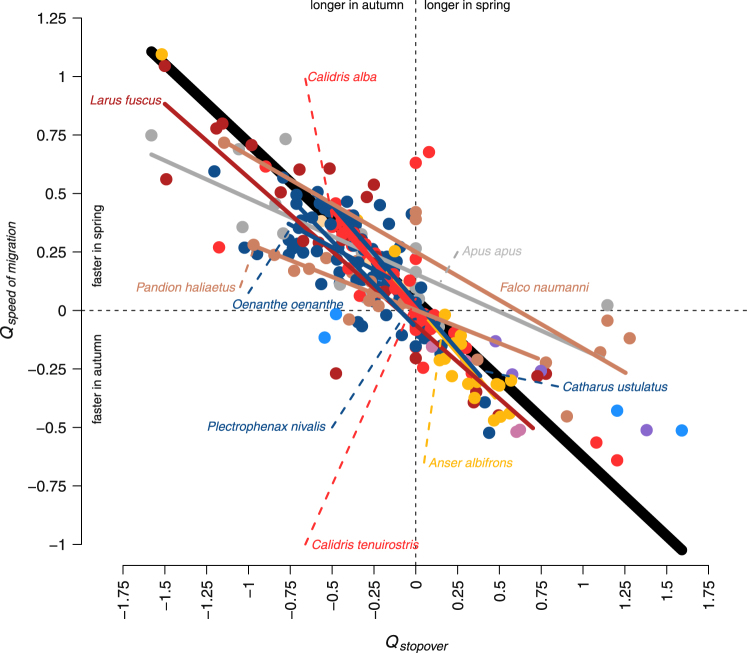
Figure 4.
Individual ratio between spring and autumn total speed of migration (Qspeed of migration) against individual ratio between spring and autumn total stopover duration (Qstopover). Qspeed of migration and Qstopover were both estimated as the log-ratio between corresponding individual values for spring and autumn. In this phylogenetic regression with intraspecific sampling errors involved in total 257 individual tracks of 42 studies, considering 22 tracks of waterfowl (orange), 4 of bustards (purple), 5 of storks (light blue), 23 of raptors (light brown), 47 of waders (light red), 27 of gulls (dark red), 4 of owls (light purple), 17 of swifts (grey), 4 of rollers (light beige), and 104 of songbirds (dark blue). The regression line based on all species and controlling for their phylogenetic relationship is given as a thick, black line; regression lines based on single species are coloured correspondingly to their bird group and species names are shown. The negative slopes demonstrate that a shorter total stopover duration in spring resulted in a higher total speed of migration in spring.

