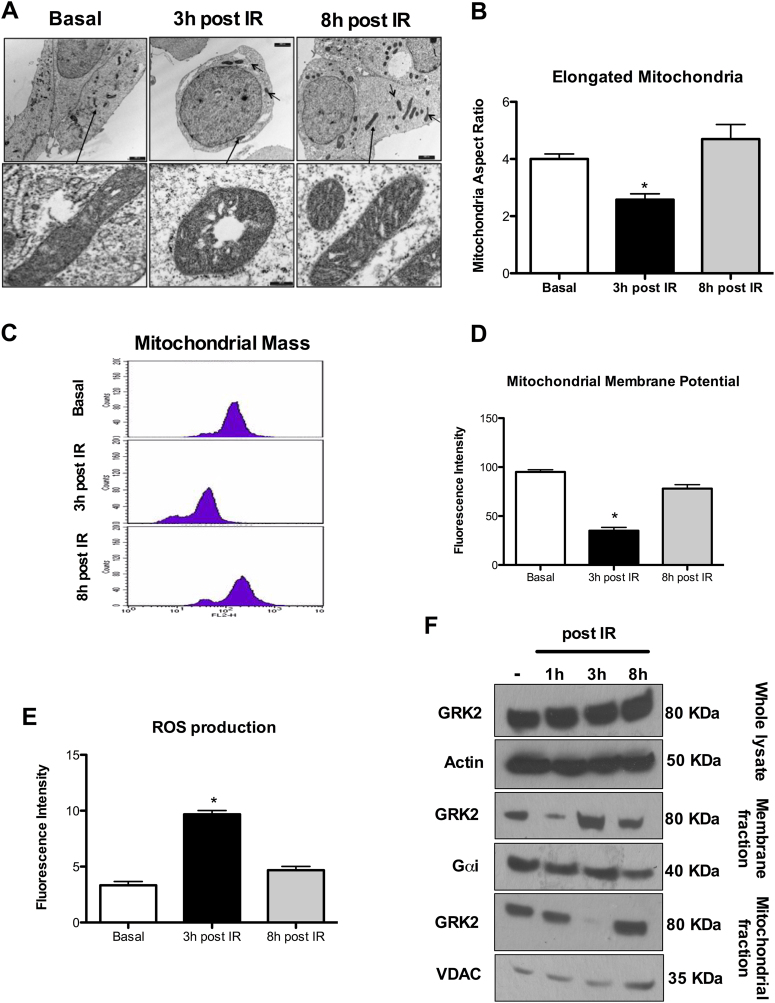
Fig. 1. Modifications of mitochondrial morphology, mass and function in HEK293 after IR exposure.
a, b Mitochondrial morphology. Representative TEM images of n = 3 independent experiments. The number of elongated mitochondria is reduced along with vacuolization and cristae disarrangement at 3 h post-IR. Mitochondrial morphology and ultrastructure are recovered at 8 h post-IR. c Mitochondrial Mass. Representative image of flow cytometry of n = 5 independent experiments evaluating mitochondrial mass by Mitotracker after IR exposure. IR exposure determinates at 3 h a significant reduction of mitochondrial mass (*p < 0.05 vs. basal) that is recovered at 8 h post-IR. d Mitochondrial membrane potential. Mitochondrial membrane potential measured by flow cytometry by TMRE (Mean ± SEM of 5 independent experiments). IR decreases mitochondrial membrane potential at 3 h (*p < 0.05 vs. Basal) with recovering at 8 h post exposure. e Mitochondrial ROS production. ROS production measured at flow cytometry by MitoSOX (Mean ± SEM of 5 independent experiments). IR produces mitochondrial ROS accumulation as evident at 3 h (*p < 0.05 vs. Basal) with normalization at 8 h post exposure. f GRK2 compartmentalization. GRK2 sub-cellular localization after IR exposure evaluated by cellular fractionation and WB. Representative image of n = 3 independent experiments. GRK2 total levels are not significantly modified after IR exposure (Top image; Whole Lysate). At 3 h post-IR, GRK2 mainly localizes at the plasma membrane with the reduction at 8 h post-IR (Middle image; Membrane fraction). GRK2 levels in mitochondria are significantly reduced at 3 h but increased at 8 h post-IR (Bottom image; Mitochondrial fraction)

