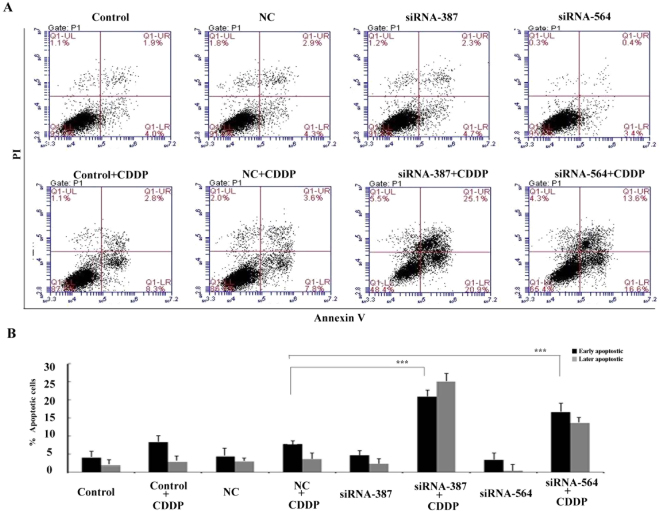
Figure 6.
Suppression of GADD45A increased cisplatin-induced cell apoptosis. (A) Annexin V/PI staining flow cytometry was performed to detect apoptosis. The lower right quadrant of the fluorescence activated cell sorting (FACS) indicates the percentage of early apoptotic cells (Annexin V-stained cells), while the upper right quadrant indicates the percentage of late apoptotic cells (Annexin V+/PI-stained cells). The cell distribution was analyzed using flow cytometry after cisplatin treatment (4 μM, 24 h). The images are representative of three independent experiments. (B) Histogram showing the percentage of early and late apoptotic A375 cells after treatment with 4 μM cisplatin for 24 h. Student’ s t-test, *p < 0.05, **p < 0.01, ***p < 0.001.

