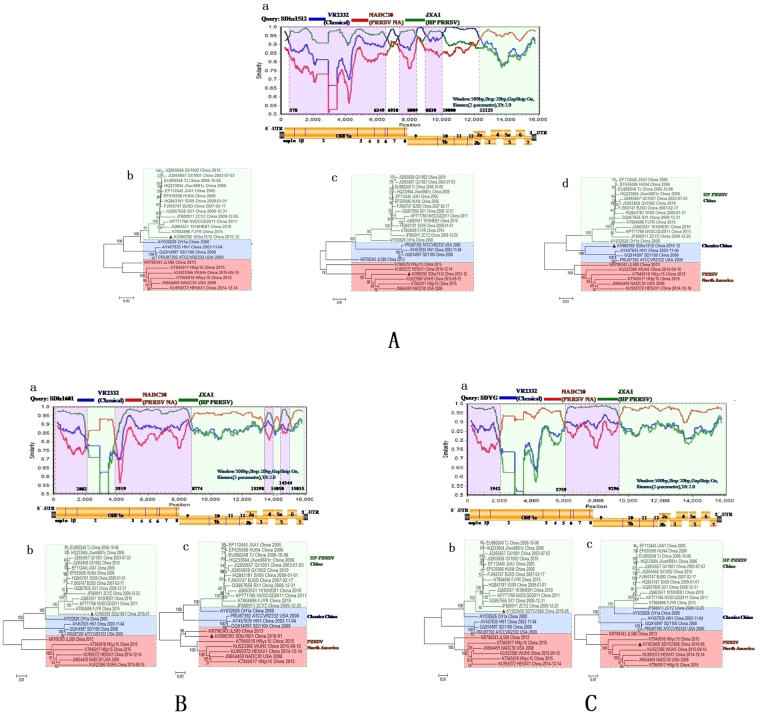
Figure 5.
Recombination analysis of the three PRRSV strains. Recombination analysis of SDhz1512 (A) SDlz1601 (B) and SDYG1606 (C) using SimPlot with a sliding window of 500 nt, moving in 20 nt steps. Genome scale similarity comparisons of three PRRSV strains (query) with NADC30 (parental group A, red), JXA1 (parental group B green), and VR2332 (outgroup C, blue). Recombination breakpoints are shown as dotted lines, with the locations indicated at the bottom. The background color of parental region A (with reference to the NADC30 strain) is light green, whereas that of parental region B (HP-PRRSV JXA1) is shaded light purple and that of parental region C (VR2332) is shaded white. The phylogenies of parental region A(c), parental region B(b), and parental region C(d) are shown below the similarity plot.

