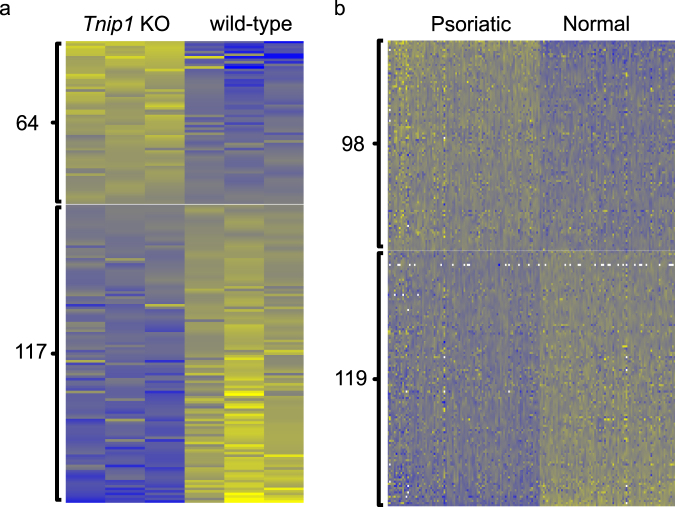
Figure 3.
Heat map of PSI values for alternative ES events in the Tnip1 KO mouse model dataset and the human psoriasis dataset. Yellow: high PSI. Blue: low PSI. (a) The heat map of the PSI values between three KO samples and three wild-type samples in mice. 64 of 181 ES events have more inclusion of variable exons in psoriasis, and 117 ES events have less inclusion of variable exons in psoriasis. (b) Heat map of the PSI values between 92 lesional psoriatic skins and 82 normal control skins in humans. 98 of 217 ES events have more inclusion of variable exons in psoriasis, and 119 ES events have less inclusion of variable exons in psoriasis.

