Figure 2.

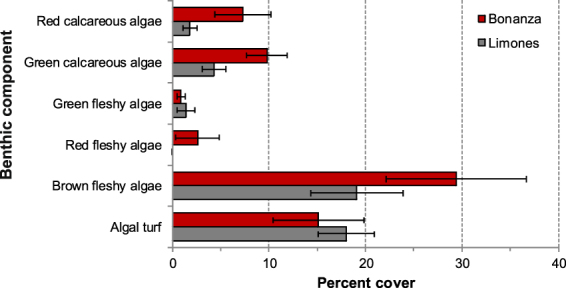
Macroalgal abundance on each reef. Percent cover of different functional groups of macroalgae on Limones (grey columns) and Bonanza (red columns) reefs (N = 8 transects per reef; error bars denote 95% confidence intervals).

Macroalgal abundance on each reef. Percent cover of different functional groups of macroalgae on Limones (grey columns) and Bonanza (red columns) reefs (N = 8 transects per reef; error bars denote 95% confidence intervals).