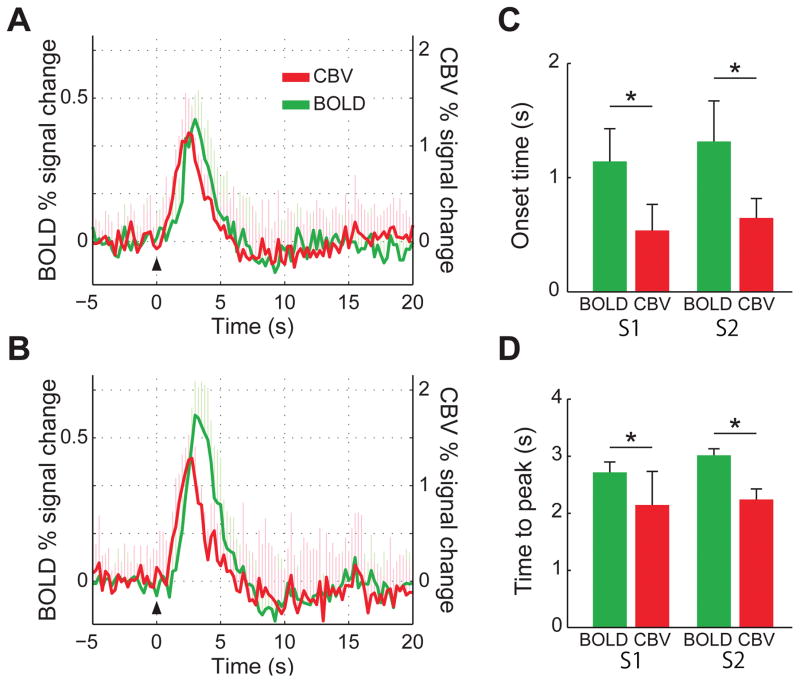
Figure 6.
(A) Mean BOLD (green) and CBV (red) HRF to a single 333 μs-long stimulus, measured in S1 and averaged across all five subjects. (B) Mean BOLD (green) and CBV (red) HRF to a single 333 μs-long stimulus, measured in S2 and averaged across all five subjects. (C) Mean onset times (OT) for BOLD (green) and CBV (red) in S1 and S2, averaged across all five subjects. (D) Mean times-to-peak (TTP) for BOLD (green) and CBV (red) in S1 and S2, averaged across all five subjects. In both regions, CBV had significantly shorter OT and TTP than BOLD. Error bars = 1 std. dev. *P < 0.05.

