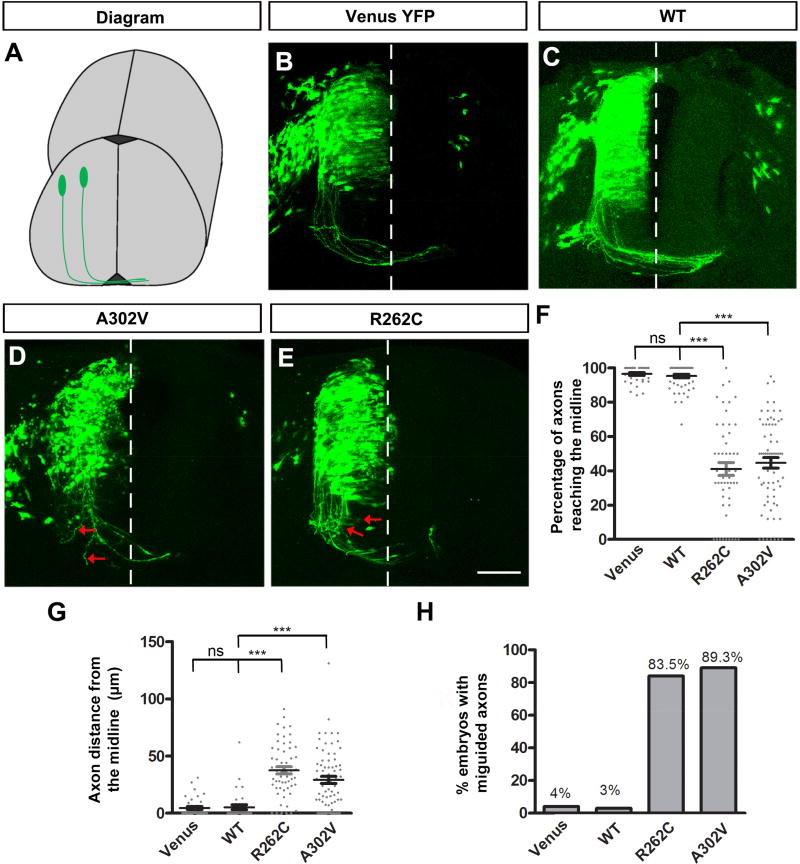
Figure 10. TUBB3 mutations disrupt spinal cord CA projection and pathfinding in vivo.
A. Schematic diagram showing chick spinal cord CA projection after electroporation. B. The chick neural tube was electroporated with Venus YFP only. C. Chick commissural neurons were electroporated with Venus YFP plus wild type human TUBB3. D. Venus YFP plus A302V were electroporated into the chick neural tube. E. Commissural neurons with Venus YFP plus R262C. The red arrows in D and E point to misguided axons. Scale bar, 100 µm. F. Quantification of the percentage of axons reaching the midline. G. Quantification of the average distance of chick CAs away from the midline. H. The percentage of embryos with misguided axons. Data are presented as the mean ± s.e.m in F–G. ***p<0.001 (One-way ANOVA with Tukey’s test for post-hoc comparisons); ns, not significant. The numbers of embryos tested were: 12 (the Venus YFP group); 15 (the wild type human TUBB3 group; 14 (the A302V group); 14 (the R262C group).

