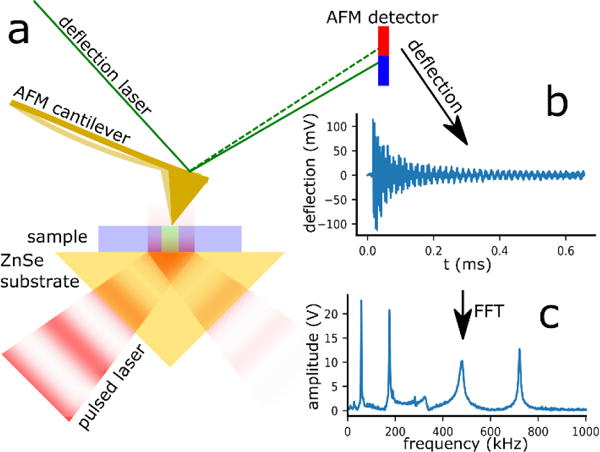
Figure 1.

a) Sketch illustrating the PTIR setup and signal generation. The sample (blue) is placed on a ZnSe Prism (yellow) and illuminated from below with a pulsed, infrared laser beam (red). The sample locations that absorb IR light, heat up and expand during each laser pulse. The expansion induced motion of the AFM tip (gold), deflection signal, is detected by the AFM detector. b) time domain PTIR signal (ring-down). c) The fast Fourier transform (FFT) on the deflection signal, yields the amplitudes of the cantilever oscillation modes which are proportional to the local infrared absorption.
