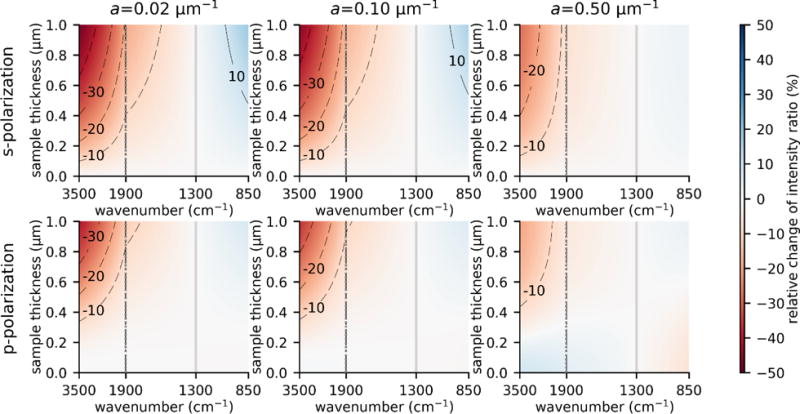
Figure 2.

Effect of ATR illumination on the PTIR band intensity ratios with respect to 1300 cm−1 (vertical grey lines). The graphs display deviations from 1 for the TMM calculated PTIR band intensity ratios with respect to 1300 cm−1 for an artificial sample with n = 1.4 and constant decadic absorption coefficient in the case of a weakly (left column), medium (central column) and strongly (right column) absorbing sample. 0 % deviation from 1 would indicate that the relative band intensity ratios are the same as in a Lambert and Beer law compliant transmission spectrum. Calculations were obtained for s-polarization (top row) and p-polarization (bottom row). The horizontal scales above 1900 cm−1 and below 1900 cm−1 are different to highlight changes in the mid-IR fingerprint region.
