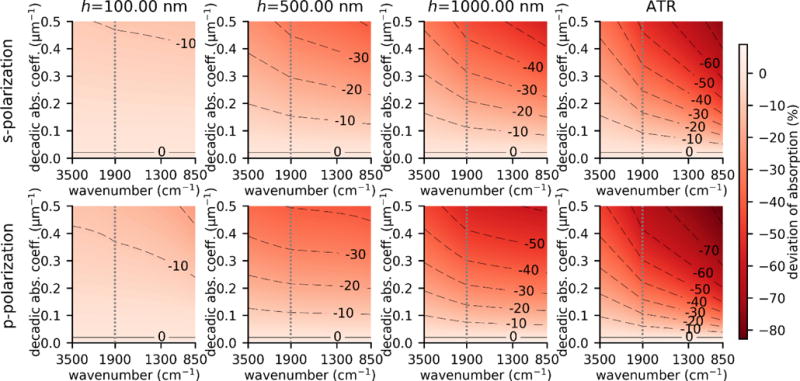
Figure 3.

Estimate of the maximum deviation of the PTIR signal from perfect linearity with respect to the absorption coefficient. For the estimate, we considered an artificial weakly absorbing material with constant a0= 0.02 μm−1 and n = 1.4 and calculated , normalized to Sample parameters were n0=2.4, n1 = 1.4 + iκ, n2=1. Calculations were carried out for 100 nm thick (1st column), 500 nm thick (2nd column),1000 nm thick (3rd column) sample and for a semi-infinite sample (4th column, labelled ATR). The horizontal scales above 1900 cm−1 and below 1900 cm−1 are different to highlight changes in the mid-IR fingerprint region.
