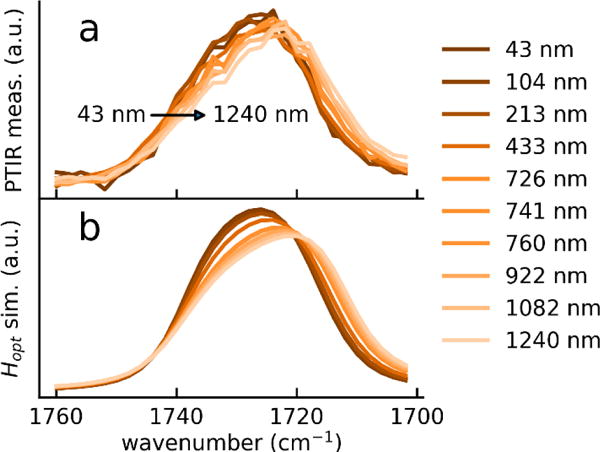
Figure 4.

Band shifts of the PMMA carbonyl band in the case of p-polarization. a) measured PTIR spectra on a PMMA wedge and b) simulated Hopt signal (using literature values for ZnSe44 and PMMA45).The sample thickness used in the simulations correspond to those measured in panel a. The spectral intensities are displayed in arbitrary units for clarity. (For s-polarization see fig. S-2).
