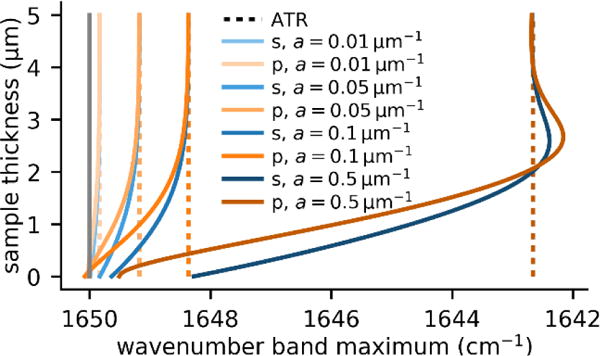
Figure 5.

Band shifts in PTIR and ATR spectra: calculated band shifts for a Lorentzian band (10 cm−1 half width) centered at 1650 cm−1 (typical spectral position of the amide I band), for absorption coefficients ranging from a = 0.01 μm−1 to 0.5 μm−1 as a function of the sample thickness (up to 5 μm). The band position in the PTIR spectrum approaches the band position measured in ATR spectroscopy, as the sample height increases. Note that typical PTIR samples are significantly thinner than 5 μm.
