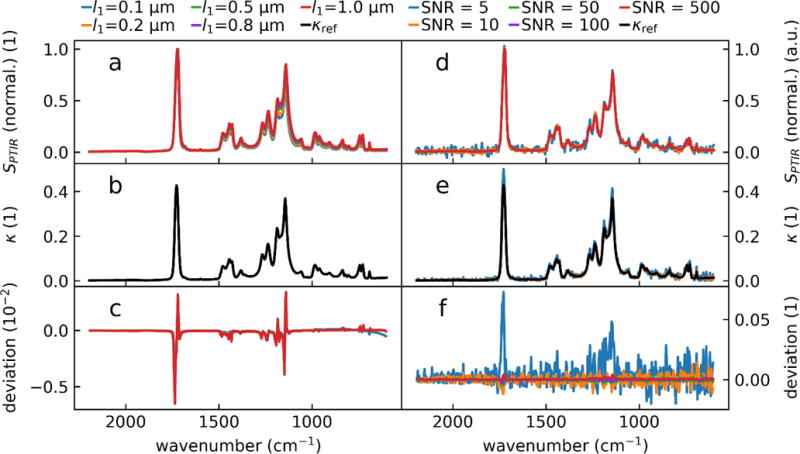
Figure 7.

Calculated κ(λ) from pairs of Hopt spectra (s- and p-polarization) for PMMA using a NLS fit a) Calculated Hopt (s-polarization only) for a series of film thicknesses. The spectra intensities were normalized at ≈ 1725 cm−1 to highlight the intensity ratio differences as a function of the sample thicknesses. For each thickness, the pair of spectra (s- and p-polarization) were scaled by an arbitrary number before the NLS fit to ensure that the scaling of the spectrum did not influence the fit. b) κ(λ) spectra as output by the NLS fit function. c) Difference between κref reference literature values and fit results. Panels d-e showcase NLS fit noise resilience. d) Noise (Gaussian distribution with standard deviation σ) was added to the simulated PTIR spectra for a 0.5 μm thick slab of PMMA. The added noise resulted spectra with SNRs (calculated from 8× the standard deviation of the noise and the maximum of the carbonyl peak). e) Recovered κ spectra from noisy input data. f) The difference of the recovered spectra and the noiseless κref Note the different scales on panels c and f.
