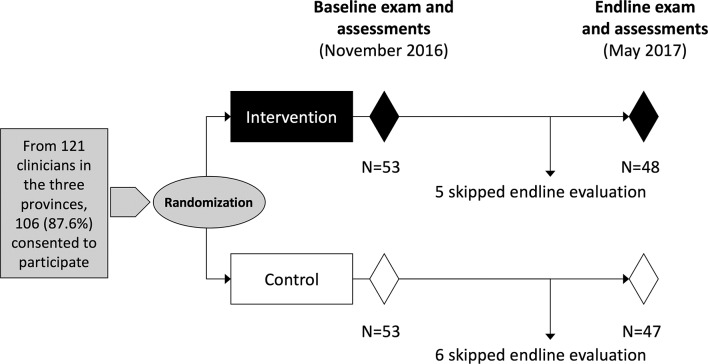
Figure 3.
Participant flow diagram within the mobile continuing medical education study. The figure depicts the randomisation into intervention/control groups, the timing of baseline/endline assessments, the duration of the study and study attrition affecting the proportion that returned for the endline assessments.

