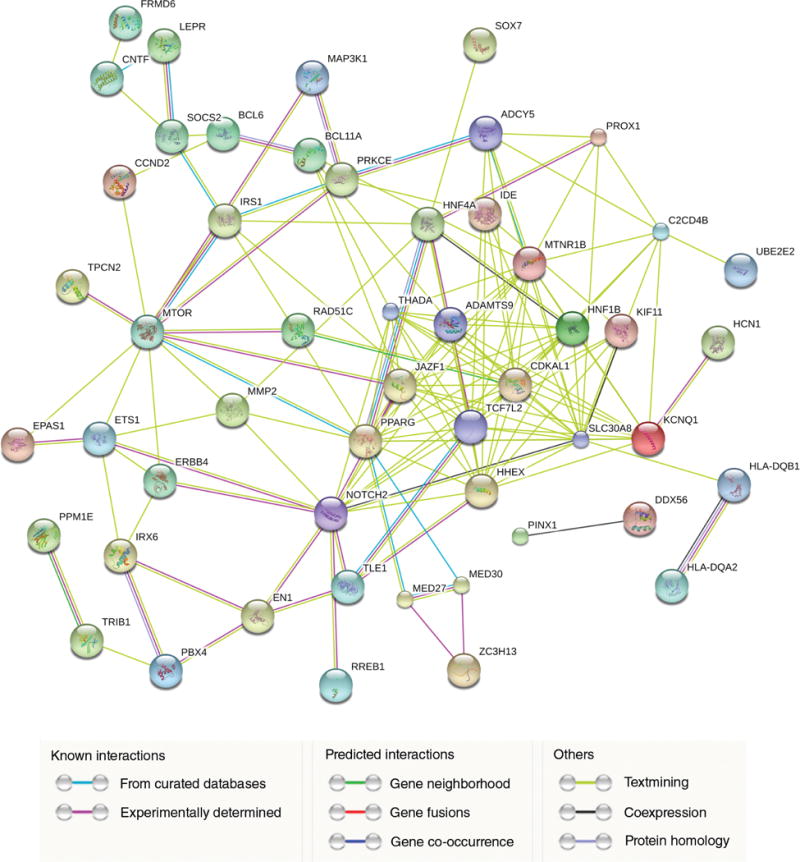
Figure 2.

Functional protein association network analysis for type 2 diabetes (T2D) susceptibility genes. Connections are based on coexpression and experimental evidence with a STRING 10.0 (http://string-db.org/, accessed 1 May 2016) summary score above 0.4. The network that related to positive regulation of cellular process and negative regulation of transcription from RNA polymerase II promoter showed significant enrichment for T2D susceptibility genes. Each filled node denotes a gene; edges between nodes indicate protein–protein interactions between protein products of the corresponding genes. Different edge colors represent the types of evidence for the association. Definitions for all protein symbols are given in Table S2.
