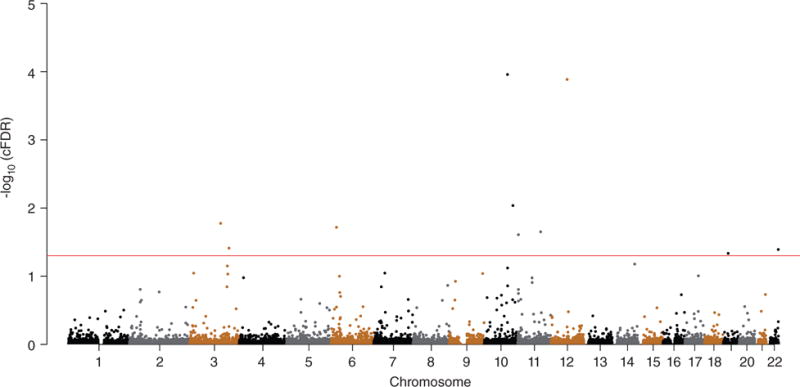
Figure 3.

“Conjunctional Manhattan plot” of conjunctional −log10 (conditional false discovery rate [cFDR]) values for type 2 diabetes (T2D) and birth weight. Single nucleotide polymorphisms with conjunctional −log10 cFDR >1.3 (i.e. cFDR < 0.05) are shown above the red line. The figure marks the chromosomal locations of significant loci. Details for all significant loci are given in Table 2.
