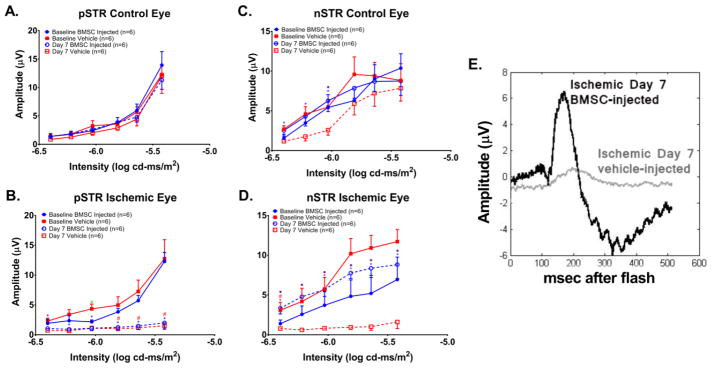
Figure 2.
(A&C) Stimulus-Intensity responses for the STR (scotopic threshold response), for the positive STR (pSTR) and negative STR (nSTR) in non-ischemic eyes of rats subjected to retinal ischemia for 55 min and the eyes injected 24 h later with BMSCs or control (PBS). (B&D) STRs recorded from the ischemic eyes at baseline and after ischemia. The recovery was measured 7 days later. Absolute amplitude appears on the Y-axis (see Methods) and the 6 flash intensities are on the X-axis. There was significant improvement in the nSTR, but not the pSTR with injection of BMSCs 24 h after ischemia. Data are shown as mean + SEM. * P < 0.05 vehicle Day 7 vs baseline; # = P < 0.05 BMSC Day 7 vs baseline; x = P < 0.05 vehicle baseline vs BMSC baseline;. = P < 0.05 vehicle Day 7 vs BMSC day 7. N = 6. (E) Representative STR traces at the highest flash intensity, with BMSC-ischemic eye on top, and PBS-ischemic eye below

