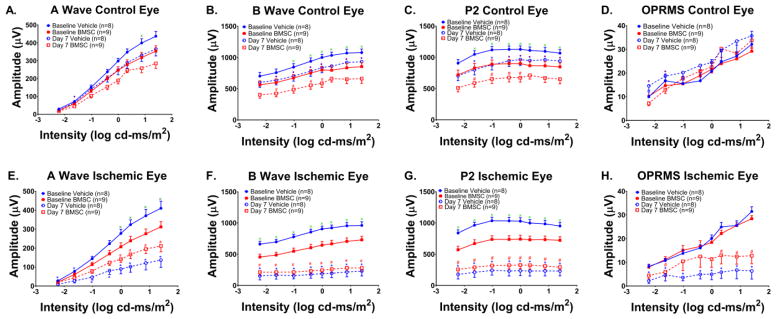
Figure 3.
(A, C, G, E) Stimulus-Intensity responses for the a wave, b-wave, P2, and OPRMS in non-ischemic eyes of rats subjected to retinal ischemia for 55 min and the eyes injected 24 h later with BMSCs or control (PBS). (B, D, F, H) Stimulus intensity responses for a, b, P2, and OPRMS waves recorded from the ischemic eyes at baseline and after ischemia. The recovery was measured 7 days later. Absolute amplitude appears on the Y-axis (see Methods) and the flash intensities are on the X-axis. Data are shown as mean + SEM. There were no differences between non-ischemic values for the OPRMS (Fig 3E), and few for the a-wave. For the b-wave and P2, both injection of BMSCs and PBS vehicle decreased amplitudes of the waveforms, and the vehicle-injected eyes had generally higher baseline amplitudes compared to the BMSC-injected. There was a greater decrease in amplitudes of the waveforms from baseline to day 7 in ischemic eyes for all waveforms for the vehicle compared to the BMSC injected eyes. * P < 0.05 vehicle Day 7 vs baseline; # = P < 0.05 BMSC Day 7 vs baseline; x = P < 0.05 vehicle baseline vs BMSC baseline;. = P < 0.05 vehicle Day 7 vs BMSC day 7. N = 8–9

