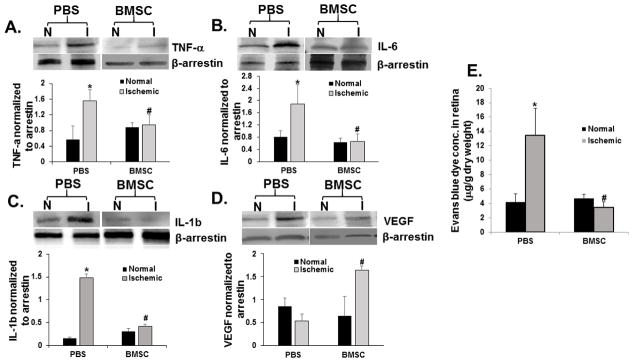
Figure 6.
Evaluation of inflammatory and vascular permeability markers. Representative Western blot illustrating TNFα (A), IL6 (B), IL1β (C), and VEGF (D). BMSC treatment significantly reduced levels of TNFα, IL1β, and IL6; and increased VEGF compared to PBS injected ischemic eyes. The bar graphs demonstrate the levels of all four proteins normalized to β-arrestin. (E) Bar graph exhibiting Evans Blue dye extravasation, marker of vascular permeability, in ischemic PBS and BMSC injected retina. Data are shown as mean ± SEM. * indicates P < 0.05 compared to the paired normal retina within a group (PBS or BMSC); # indicates P < 0.05 between the ischemic retinae of PBS and BMSC. N = 3–4 per group for Western blotting, and 7 for Evans Blue. See Figure 4 legend for abbreviations.

