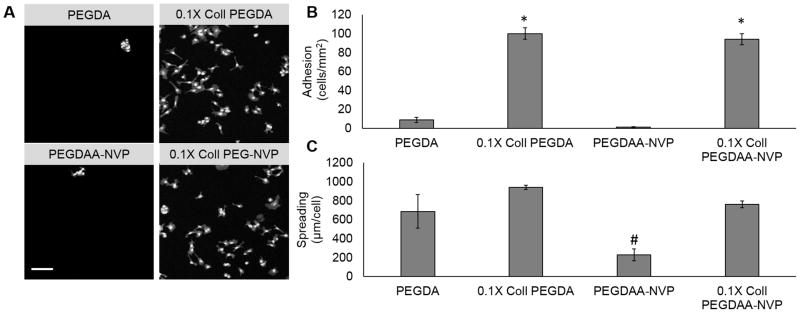
Figure 6.
A) The effect of hydrogel composition on cell adhesion. Scale bar = 100μm. B) BAEC attachment on both compositions with incorporated functionalized collagen. C) BAEC spreading on both compositions with incorporated functionalized collagen. Data represents average ± standard error of n=4. The * represents a difference between groups with and without collagen (p<0.05), and the # represents a significant difference from all others (p<0.05) in ANOVA with Tukey’s multiple comparison test.

